Monthly Report – March 2023

During this month, all eyes will be on the upcoming FED rate decision meeting. The US central bank is likely to raise interest rates by another 25bps at least two times this year, however, the main question remains how high rates can go in 2023. In the last FOMC meeting, Chair Powell said that the FED will keep monitoring inflation levels and will be ready to tighten the current monetary policy further if needed. Looking at inflation expectations, the monthly update of the US Consumer price index is expected to have declined from 0.5% to 0.4%, if the figures match forecasts, this will likely push the FED to revise its aggressive monetary policy by reducing the pace of future rate hikes. This scenario will help the US stock market to stabilize and recover some of the early losses, while the US Dollar is likely to retreat. In addition, the labor market remains resilient, however, forecasts are pointing to a lower reading in March. Analysts are seeing the US economy adding only 200K new jobs in February compared to 517K registered previously. On the other side, the unemployment rate is due to rise from 5.0% to 5.1%. 
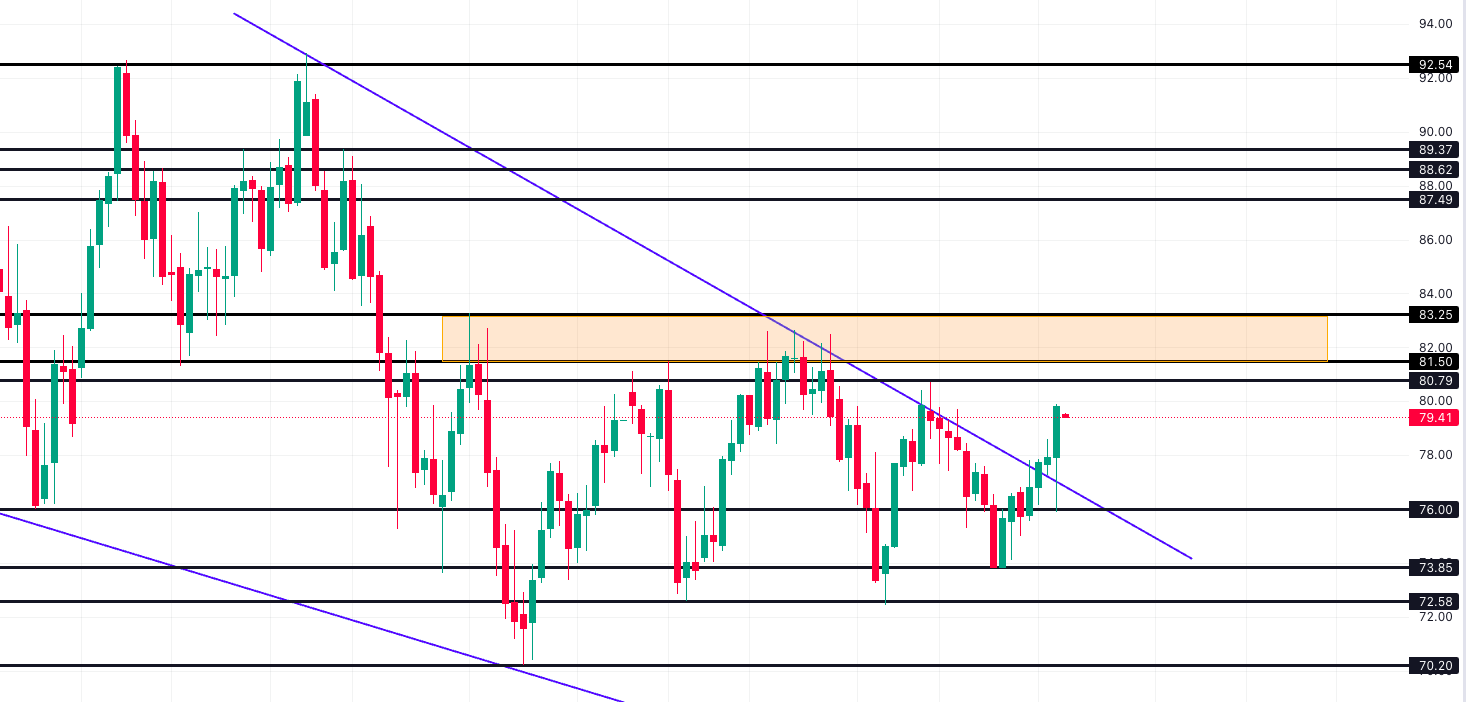
Oil prices are expected to rise in March and challenge the $80 per barrel after reports that the UAE is thinking about leaving the OPEC group coupled with growing demand from China. 
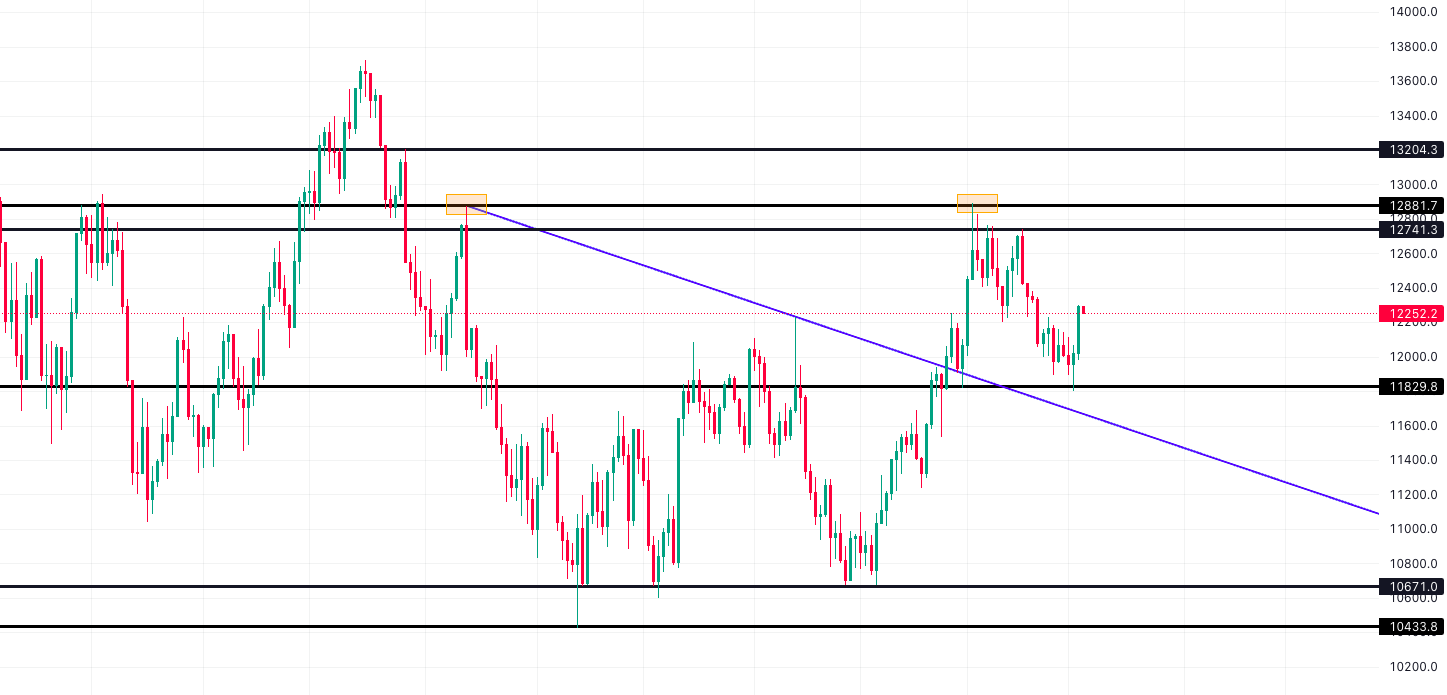
Now let us have a look at the monthly technical outlook for major currencies, commodities, and indices.

EURUSD

The Euro formed a double-bottom bullish reversal pattern which can lead to a potential recovery during this month. Technically, the bearish trend that started in early February remains in place, however, if the pair succeeds to hold above the 1.0530 support during the month, there will be a high probability of seeing the single currency stabilizing before to aim for the 1.0700 handle in the coming days. Therefore, the pair is expected to trade sideways, until we see a clear break either above the 1.0700 resistance or below the 1.0530 support which is considered the range of the Euro for this month. A successful daily close above 1.0700 can lead to a continuation higher in the direction of the 1.0770-1.0800 resistance zone, on the opposite, a daily close below 1.0530 support should confirm the latest decline and target the 1.0400 level.

GBPUSD

Despite the recent selling pressure, the British pound showed strong demand near the psychological support of 1.1900. The pair managed to bounce three consecutive times from the 1.1920 level as bearish momentum started to weaken. From a wider angle, the pair is trading sideways between the 1.2145 resistance and 1.1920 support, and the trend is expected to remain neutral. Looking at the recent price action, recovery attempts are likely to face strong resistance at the 1.2145 level. This is a key level for the future direction that might take this pair and a daily close above it is needed to confirm the bullish reversal scenario and open the path for a retest of the 1.2270 peak. Conversely, a close below 1.1900 psychological support will be crucial and can put the pair under strong selling pressure toward 1.1840 followed by the 1.1780 level in extension.

USDJPY

The currency pair is following a strong uptrend formed by a series of higher highs and higher lows since the bottom registered on February 14th. Technically, we can see a continuation of the existing bullish momentum, however, a breakout above the 137.00 barrier is needed, to aim for higher prices that can reach 137.50 followed by 138.15 in extension. Meanwhile, if the pair remains well below the resistance mentioned above, a short-term bearish retracement should start and can lead to a retest of the 135.30-135.00 support zone before another wave higher starts. Overall, the bullish momentum is expected to stay unchanged unless we see a daily close below the 134.00 monthly support.

USDCAD

USDCAD managed to break above the important resistance level of 1.3520 and a key falling trendline which keeps the upside pressure intact. In March, traders will be looking for the Bank of Canada’s interest rate decision which is expected to remain unchanged as the Central bank decided to pause the rate hikes program to assess the impact of its recent monetary policy on the Canadian economy. This decision can weigh on the Canadian Dollar in the near term and push the USDCAD pair to higher levels. From a technical standpoint, if the pair continues to trade above 1.3520, the bullish momentum is likely to remain strong and buyers will be looking for a retest of the 1.3665-1.3700 monthly resistance zone. In extension, a daily close above this resistance area should clear the path for another acceleration higher in the direction of the 1.3800 level. On the opposite, a breakdown below 1.3520 support will weaken this positive scenario and lead to a decline in the direction of the 1.3430 followed by the 1.3360 level.

GOLD

Gold is expected to recover a part of the early losses seen in February as the yellow metal demand is growing. This month, traders should keep an eye on the 1800 level as it represents strong support. Looking at the chart below, we can see that prices succeeded to overtake the falling trendline drawn from 1870 high, reinforcing the positive outlook. In the meantime, the current advance may face strong sellers from the formerly broken support zone of $1865-1870 per ounce, which will likely play the role of resistance in the coming days. The key support levels during this month are 1840 followed by 1830 and 1823 in extension, on the other side, the main resistance levels stand in 1860, 1870, and 1890. To conclude, the gold technical picture remains positive over the long term, however, the current recovery is expected to stall below the peak of 1890 registered on February the 9th.

OIL (WTI)

Crude Oil is expected to rise in March as prices managed to break above a key important trendline and create a higher low at 73.85 low. Looking at the biggest technical picture, Oil prices are stuck inside a wide range formed by the 81.50-83.25 resistance zone from the top and the 72.60-70.20 support zone from the bottom. For the time being, and looking at the recent price developments, Crude oil bulls are expected to send prices higher toward the resistance zone mentioned above in the coming weeks. Moreover, any potential decline should be considered temporary, and traders will be looking for intermediate support between 78.50 and 77.25 levels. This scenario should remain valid only if prices continue to trade above the 76.00 low. In extension, a close above the 83.25 resistance level should trigger a big rally in Oil.

Dow Jones (US30)

After failing to overtake the key technical resistance level of 34350, the Dow traded lower in the previous days and sellers managed to challenge the support zone located between 32,620 and 32,450 levels. From a wider angle, the US index is looking for a clear direction as the trend remains neutral. Buyers succeeded to defend the support zone mentioned above, therefore, we continue to expect choppiness during this month, and we might see the current bounce extending higher toward 33,500 followed by 33,850 levels which are considered important resistance levels in March. To summarize, the trend is neutral in the Dow Jones index, meanwhile, when looking at the recent price action, we might see higher prices in the coming days first, before seeing a price stabilization as the index should remain well supported above the 32,450 low.

S&P500 (SPX)

The S&P 500 managed to bounce from the 61.8% Fibonacci retracement of the recent advance that started from the 3765 low. In addition, prices regained the rising trendline and bounced from the support of the 3940 level as shown in the chart below which keeps the index steady. In March, we continue to expect the index to see rising demand and start another advance for a re-test of 4100 initially, followed by the 4200 area. Moreover, a close above the 4200 resistance should confirm the positive momentum in the S&P and send prices higher in the direction of the August peak. In the coming days, the index is likely to remain well-supported unless we see a weekly close below the 3900 psychological support, which can lead to a downside trend reversal.

NASDAQ 100 (NAS)

The Nasdaq index remains in a neutral trend despite that since the beginning of the year, prices have formed a series of higher highs and higher lows from the 10,670 bottom. As of now, the bullish momentum is likely to remain unchanged unless we see a daily close below the 11,540 level. In the coming days, if the index manages to hold above the 11,850 level which is considered key support for this month, we might see an attempt to reach the 12,740-12,880 resistance zone. In extension, a close above 12,880 resistance should lead to another rally toward the 13,200 level, while a breakdown below 11,850 can expose 11,540 support.
امين-حياني
 

Economic Analyst
Amine Hiani

Scroll to Top