Monthly Report – April 2023

April is likely to be an interesting month as we kick off the second quarter of the year.
The FED raised interest rates by 25bps only in March, which shows that the US central bank is clearly slowing down the rate hike pace, which can lead to a potential pause in the current monetary policy tightening cycle. The FED goal remains clear, lowering inflation, however, reaching a soft landing is not an easy task amid an unstable economic environment.   
The recent crisis in the banking sector is also weighing on FED’s future decisions. For those reasons, the US Dollar is expected to remain under pressure during this month.
Meanwhile, the labor market might face some weakness in April, the NFP forecasts are pointing to a lower reading. Analysts are seeing the US economy adding only 238K new jobs in March compared to 310K registered previously. On the other side, the unemployment rate is likely to remain unchanged at 3.6%.
The FED will continue to monitor inflation levels through the CPI figures and the latest developments in the labor market.

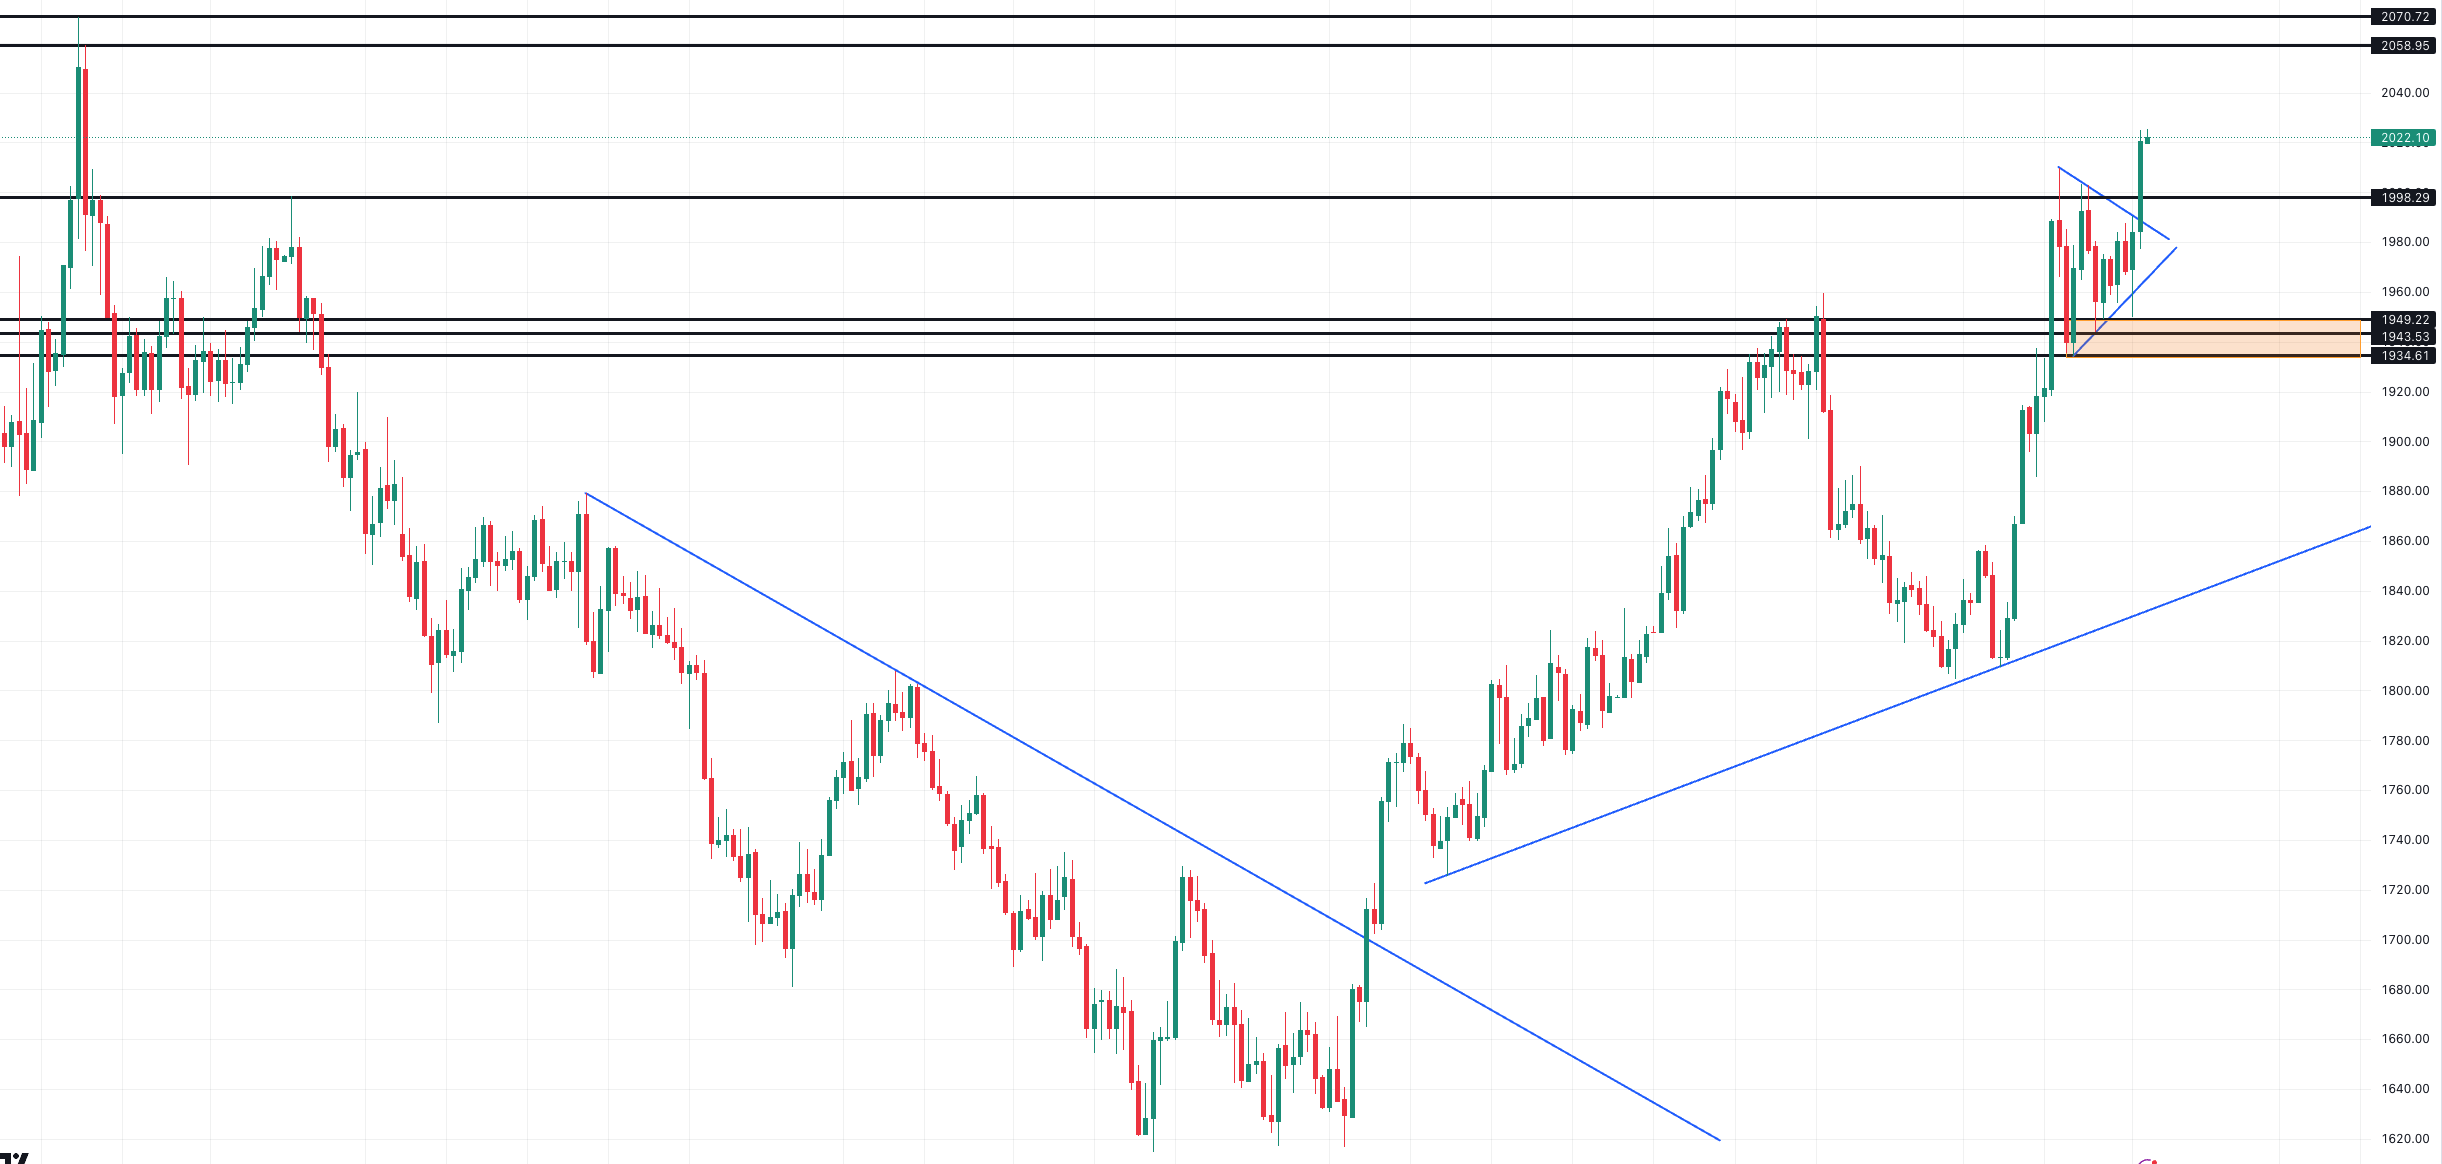
Consequently, there are high chances for gold to continue to shine as investors can look for asset rotation to hedge their risk exposure, and historically, the yellow metal remains an important safe haven during difficult times.

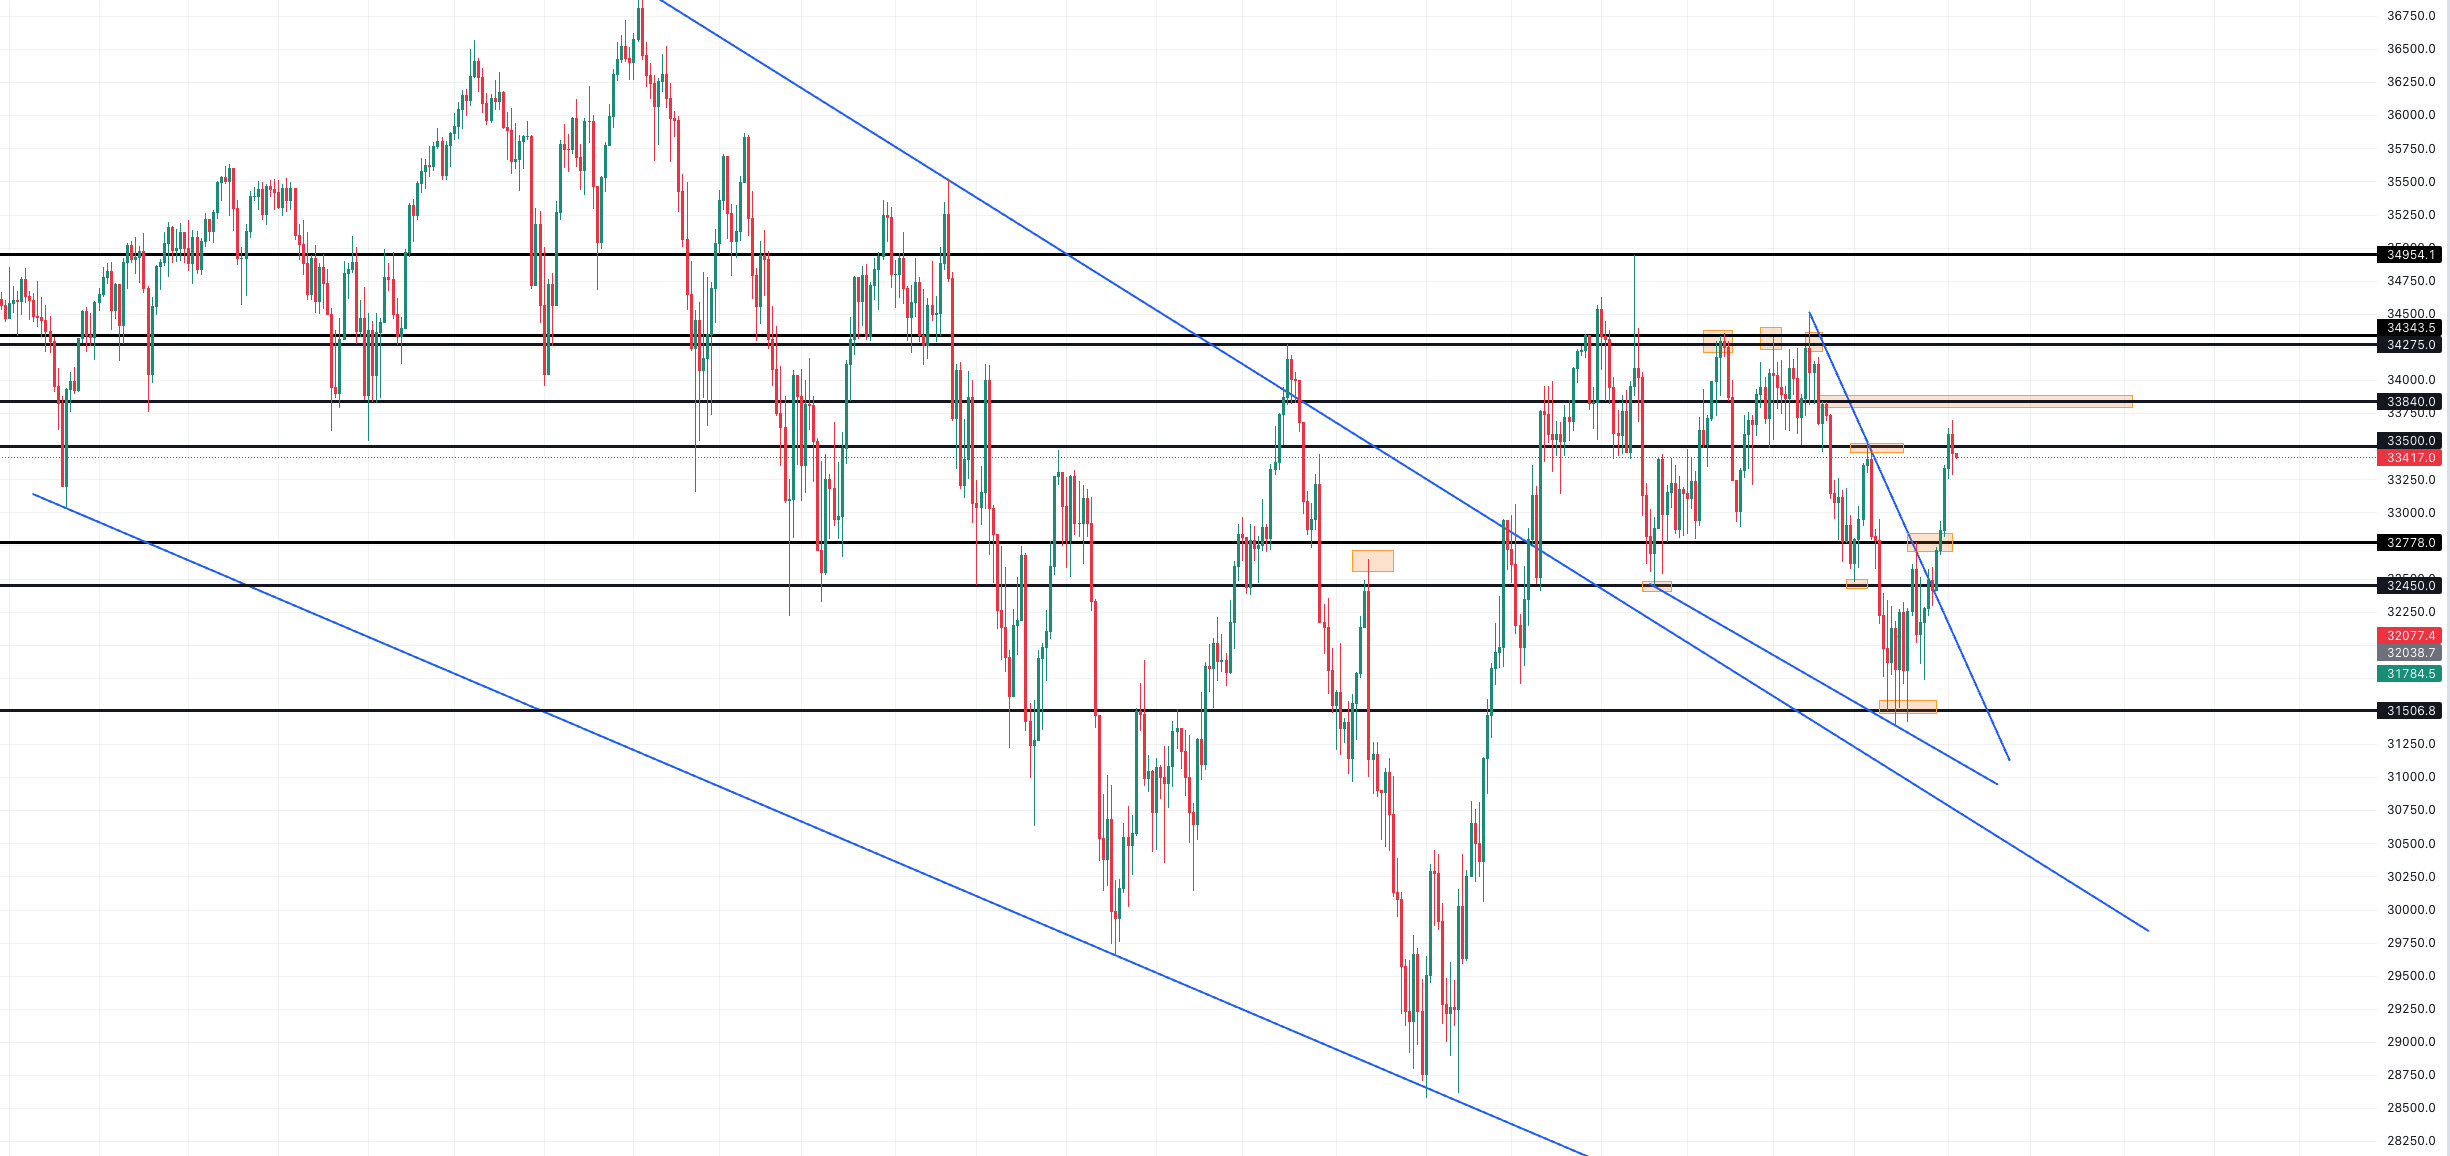
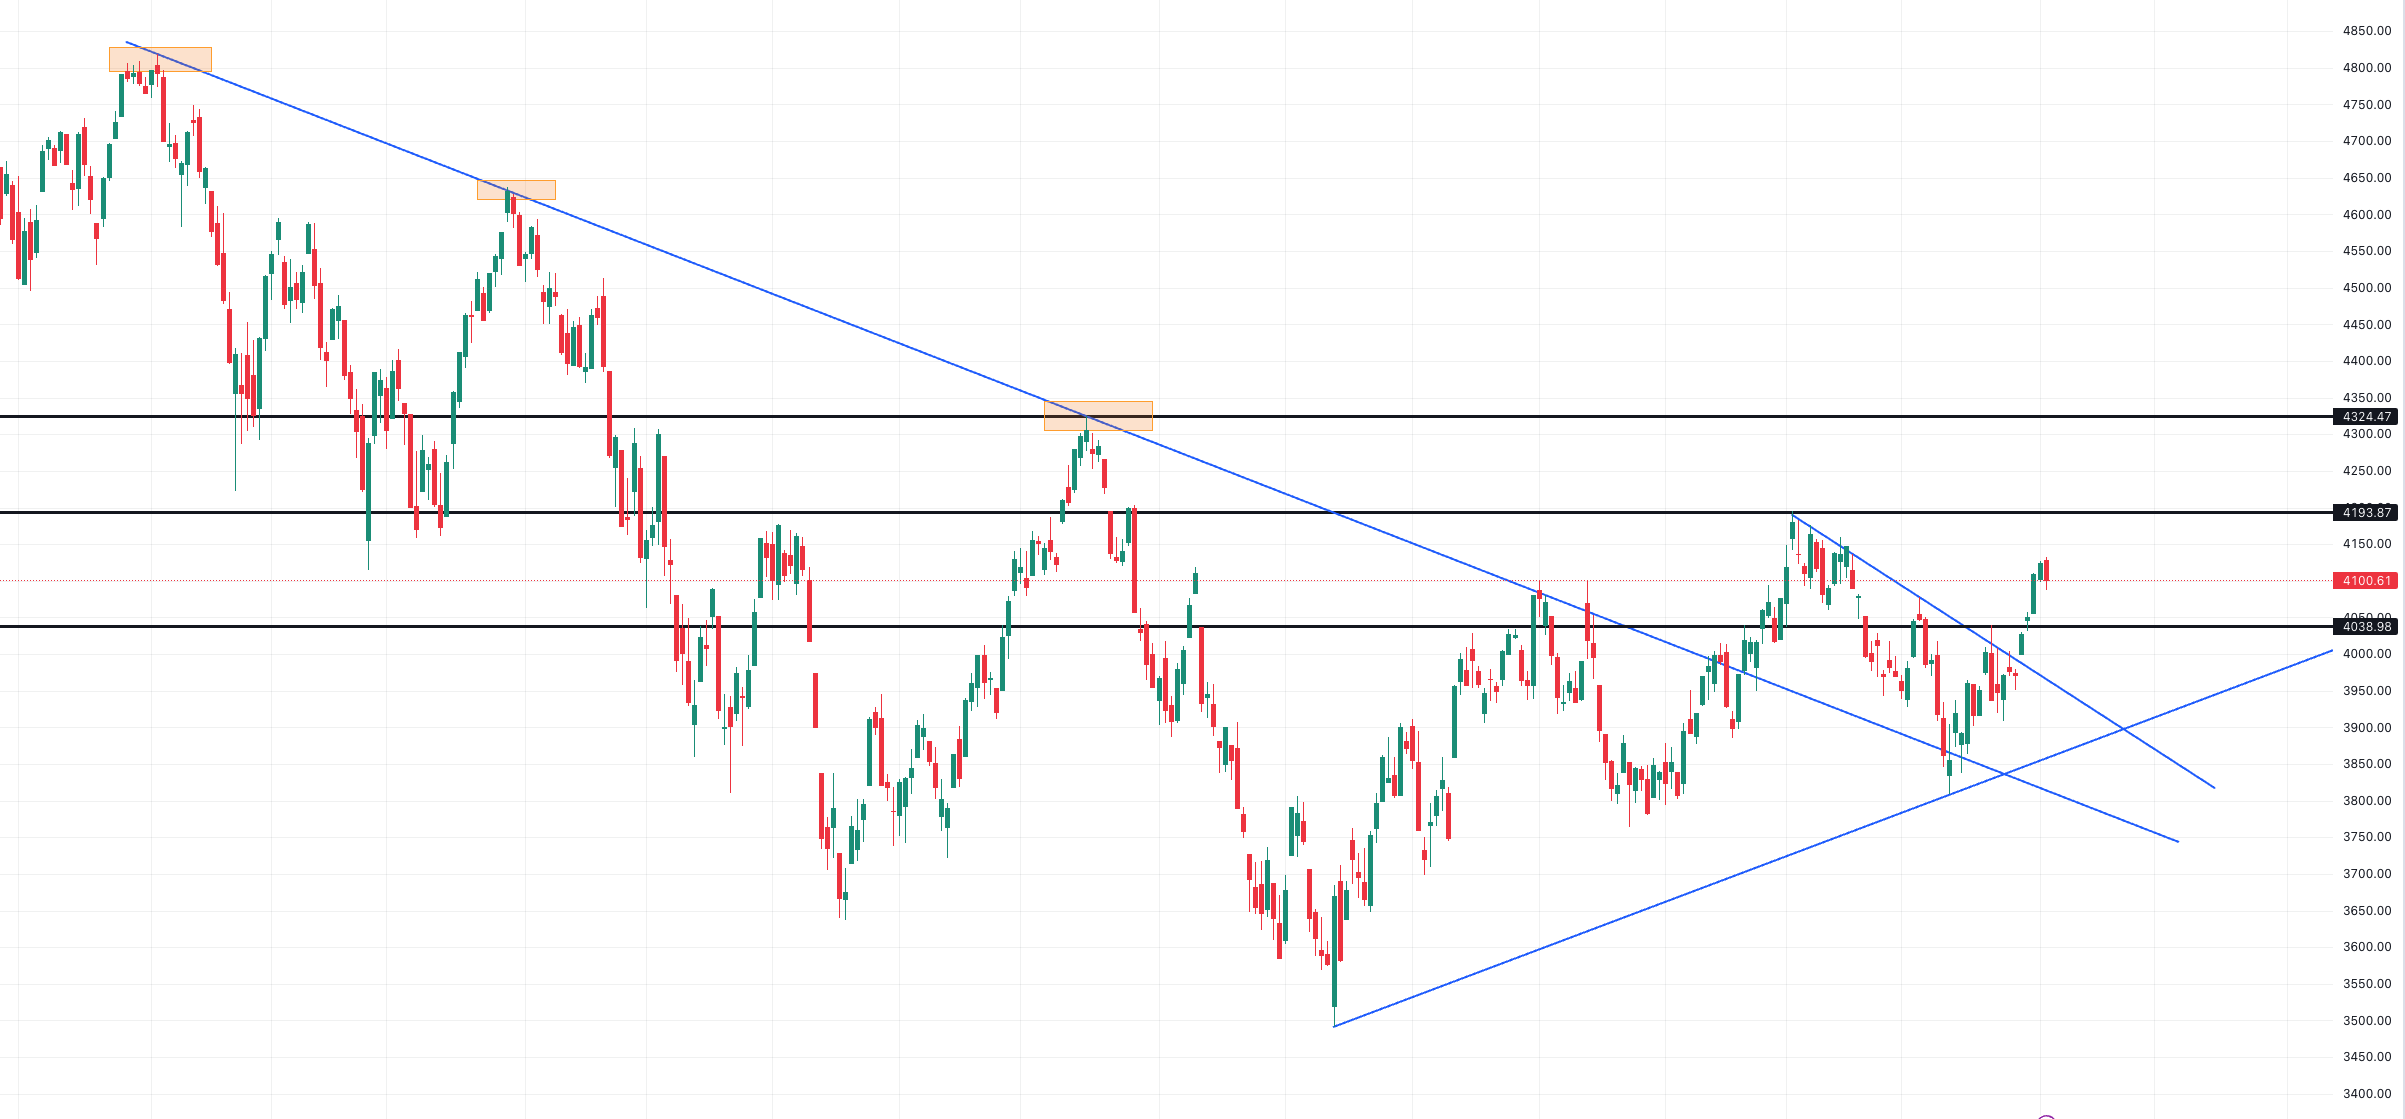
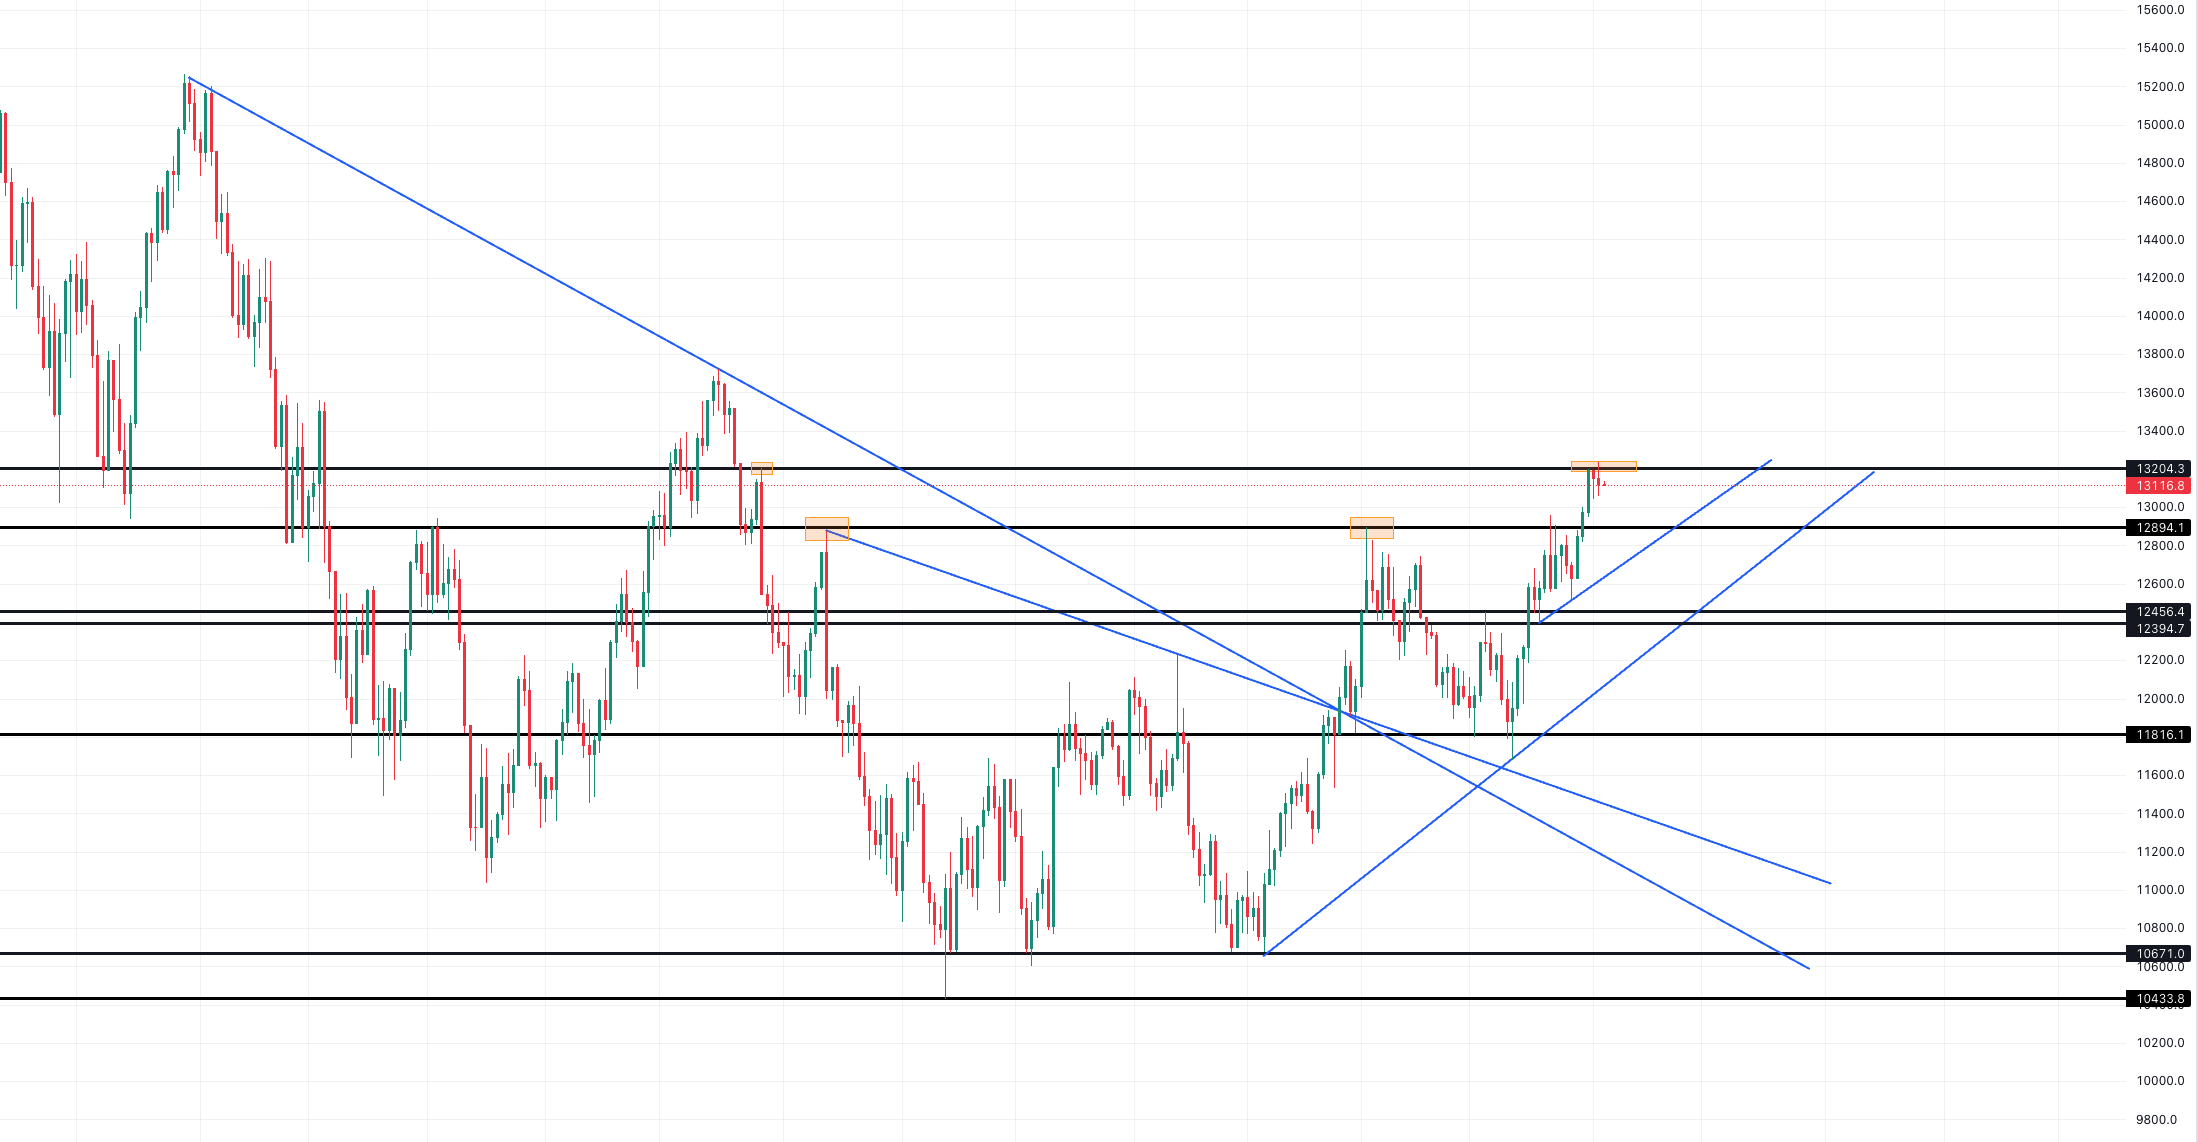
On the other side, following a short-term recovery, the US stock market might stabilize until we see how the FED will react to upcoming economic data.
Finally, Oil prices are expected to rise in April and challenge the $83 per barrel after reports that large oil producers with the OPEC+ group agreed to lower production by more than 1M barrels per day, starting at the beginning of next month and lasting toward the end of this year.
The decision of cutting production can create a strong imbalance between supply and demand levels and fundamentally, oil prices are expected to remain steady.
Now let us have a look at the monthly technical outlook for major currencies, commodities, and indices.

MONTHLY REPORT

EURUSD

The Euro found a bottom at the 1.0530 level as we have seen a failure to break below this level three times in a row. 
Moreover, the single currency managed to break above the falling trendline drawn from February’s peak as shown in the chart below, which reinforces the bullish momentum. 
Technically, the trend has switched from bearish to bullish, therefore, the pair is expected to trade higher, targeting last month’s highs at 1.1033 while a clear breakout above this level can clear the path for the next resistance at the 1.1120 level.
To conclude, the Euro is expected to hold steady during this month while prices continue to trade above the 1.0790 low. On the opposite, only a weekly close below this level, can weaken the current positive outlook and send prices toward the 1.0700-1.0640 zone.

GBPUSD

The British pound managed to bounce strongly from the 1.1800 support and for the time being, the pair is challenging an important resistance zone. 
Following the strong recovery, we have seen by the end of last year. The pair traded inside a wide range since the beginning of the year located between 1.1800 support and 1.2440 resistance. Looking at the recent price action, we can see that the trend has changed from neutral to bullish as the recent advance took the form of a series of higher highs and higher lows.
The key level to break is 1.2515 in April, a successful breakout above it can clear the path for a strong rally that can reach the 1.2670 peak, which represents the highest level registered in May of last year. It is important to note that the bullish trend is likely to remain in place while prices continue to trade above the 1.2280 low.
Conversely, a weekly close below 1.2280 support will threaten the bullish momentum and can put the pair under pressure.

USDJPY

The currency pair faced strong sellers during the last month, and the trend has turned bearish.
Technically, we can see a continuation of the existing bearish momentum, however, a breakdown below the 130.45 support is needed, to aim for lower prices that can reach 129.80 followed by 128.30 in extension. 
Meanwhile, if the pair remains well below the key monthly resistance of 133.80, any recovery attempt is likely to face heaving selling pressure for a continuation lower. Therefore, traders should focus on the dominant trend only.
Overall, the bearish momentum is expected to stay unchanged unless we see a weekly close above the 133.80 monthly resistance.

USDCAD

USDCAD failed from a key technical resistance which stands at 1.3850. 
In April, traders will be looking for a continuation lower of the recent down move following the Bank of Canada’s decision to pause the rate hikes program for the coming months following a series of rate hikes.
It is also important to note that the USDCAD pair has an inverse correlation with Oil prices, therefore a strong rally in Oil this month can keep this pair under pressure.
From a technical standpoint, if the pair continues to trade below the 1.3630 level, the bearish momentum is likely to remain strong and sellers will be looking for a retest of the 1.3360-1.3320 support zone. However, a potential retracement higher is still possible as the pair has reached the oversold territory. Meanwhile, the upside potential should remain limited, and sellers are expected to challenge recovery attempts from the 1.3560-1.3580 resistance zone if tested in the coming days.

GOLD

Gold rallied as expected after successfully breaking above the 2000 psychological barrier. 
Recently, we can see that prices succeeded to overtake the upper limit of the consolidation triangle shown in the chart below, breaking above the 2009 level which represents last month’s high and reinforces the positive outlook.
Technically, despite the extended move to the upside, the bullish momentum remains strong, and there are no signs of potential reversal for the time being. Consequently, traders should focus on opportunities within the uptrend only as it is the dominant trend.
If we do see a potential retracement lower, on the back of profit-taking later this month, the focus will be on the 2000-1985 zone as it represents an important support zone for Gold.
From this zone, a continuation higher is likely, on the other side, only a weekly close below the 1950-1935 zone will cancel this positive scenario.
To conclude, the gold technical picture remains positive over the long term, and buyers are expected to target $2050 per ounce followed by all-time highs near the 2070 level.

OIL (WTI)

Crude Oil is expected to rise in April as prices managed to break above a key important trendline after showing a strong gap up.  
Looking at the biggest technical picture, Oil prices continue to trade inside a wide range formed by the 81.50-83.25 resistance zone from the top and the 72.60-70.20 support zone from the bottom. Last month, we have seen a false breakdown out of this range formation as prices reached a low of $64.50 before bouncing strongly and stabilizing above the 80 psychological barrier.
For the time being, and looking at the recent price developments, Crude oil bulls are expected to send prices higher toward the top of the range levels mentioned above in the coming weeks.
Moreover, any potential decline should be considered temporary, and traders will be looking for support between the 79.00 and 77.50 levels.
This scenario should remain valid only if prices continue to trade above the 77.50 level. In extension, a close above the 83.25 resistance level should trigger a big rally in Oil toward the 86.70 resistance level.

Dow Jones (US30)

The Dow Jones traded higher last month as buyers managed to push prices above the falling trendline drawn from February highs as shown in the chart below. 
From a wider angle, the US index is looking for a clear direction and we can see say the trend remains neutral. We expect this index to stabilize in the coming days as prices have reached the 61.8% Fibonacci retracement of the recent decline that started from the 34,520 high.
Therefore, we might see a retracement lower at the beginning of April that can reach the 33,000-32,900 zone before seeing another bounce.
To summarize, the trend is neutral in the Dow Jones index, with 33,700-33,850 as the nearest resistance while the closest support zone to focus on is located between 33,000 and 32,900 followed by the 32,780 level in extension.

S&P500 (SPX)

The S&P 500 managed to bounce from the key support of 3800, moreover, we have seen a successful breakout above the 4040 resistance which keeps the bullish momentum in place.  
The index remains well supported above the 3900 support initially, and any potential retracement is expected to find strong demand from the 4040 formerly broken resistance which is likely to turn into support in the coming days.
In April, we continue to expect the index to see rising demand and start another advance for a re-test of the 4200 level. Moreover, traders should focus on the series of higher highs and higher lows formed during the recent advance to assess the strength of the current trend.

NASDAQ 100 (NAS)

The Nasdaq trend has turned from neutral to bullish as the index entered a bull market following its rise of more than 20% since December’s low. 
For the time being, the index is testing an important resistance located at the 13,200 level. A successful breakout above it can lead to a continuation higher in the direction of the next resistance located at 13,500 followed by 13,700 level in extension.
Prices have formed a series of higher highs and higher lows from the 10,670 bottom.
Therefore, the bullish momentum is likely to remain unchanged unless we see a daily close below the 12,400 level which represents the key support to watch in April. In the coming days, if the index fails to break above the 13,200 level, we might see a move lower to reach the 12,700-12,550 support zone before the uptrend resume.

امين-حياني
 

Economic Analyst
Amine Hiani

Scroll to Top