
Technical analysis, without the certainty
Every indicator on this page describes what price has already done. None of them knows what it will do next. Start there and the rest makes sense.
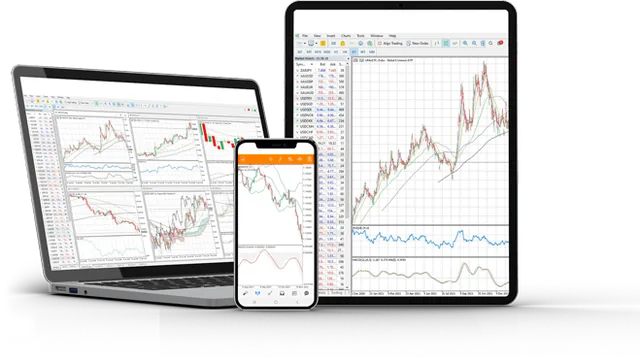
Both platforms
Live chart, on the phone you already have


FSA-licensed broker · Licence SD133
What an indicator actually is
Every indicator is arithmetic on past prices. A moving average is the average of the last N closes. RSI compares recent gains to recent losses. MACD subtracts one moving average from another. That is genuinely all they are.
This matters because it explains their central limitation: an indicator cannot lead price, because it is computed from price. When someone shows you a chart where RSI called the top, they are showing you a chart where price made a top and RSI, being arithmetic on that price, moved with it.
They are still useful. They compress a lot of price action into one readable line, and they make you consistent — the same rule applied the same way every time. That is worth having. Prediction is not on the list.
An indicator cannot lead price. It is calculated from price.
The four you will actually meet
| Indicator | What it measures | Where it misleads |
|---|---|---|
| Moving average | Average price over N periods | Lags hardest exactly when price turns |
| RSI | Recent gains vs recent losses, 0–100 | "Overbought" can stay overbought for weeks in a trend |
| MACD | Difference between two moving averages | Crosses constantly in a sideways market |
| Bollinger Bands | Volatility around a moving average | Touching a band is not a reversal signal |
Support, resistance and Fibonacci
Support and resistance is the most useful idea in technical analysis and the least mystical. A level matters because a lot of people are watching it and acting near it — that is the whole mechanism. It is not physics.
Fibonacci retracements work the same way. There is no mathematical law making price respect 61.8%. It is watched by enough traders that it becomes mildly self-fulfilling, which is a real effect but a much weaker claim than the one usually made for it.
The practical consequence: treat levels as places where something might happen and where your risk is definable, not as predictions. A level is useful because it tells you where you are wrong, not where price is going.
How to actually use any of this
- Pick two tools, not eight. Eight indicators on one chart produce a signal for every possible action, which is the same as no signal.
- Decide the rule before the trade. A rule you apply after seeing the chart is not a rule, it is a justification.
- Test it forward on a demo. A setup that looks obvious on a chart of the past is obvious because you can see what happened next.
- Know the market condition first. Trending or ranging. Almost every failed indicator trade is the right tool in the wrong condition.
- Size the position before the entry. No amount of analysis survives a position too big to hold.
Common questions
Which indicator is the most accurate?
None of them predict. They describe past price with different arithmetic. The useful question is which one suits the market condition you are in — trending or ranging.
Does RSI above 70 mean I should sell?
No. In a strong trend RSI can sit above 70 for weeks while price keeps rising. "Overbought" describes momentum, not a reversal.
Do Fibonacci levels really work?
They are watched by enough traders to be mildly self-fulfilling. That is a real but weak effect, and much less than is usually claimed.
How many indicators should I use?
Two, at most three. More produce a signal for every action, which is the same as none.
Are indicators free on MT4 and MT5?
Yes. Everything described here is built into both platforms at no cost.