Monthly Report

February is likely to be a positive month for the US Dollar as traders might start looking to rebalance their positions following the latest FED interest rate hike.
The better-than-expected GDP figures coupled with the recent strong jobs report published on Friday are likely to support the Greenback in the coming days.

The US Dollar managed to bounce from a 9-month low on rising inflation concerns that should keep the US monetary policy tight. Chair Powell mentioned during the FOMC press conference that the FED is not ready to pause its aggressive rate hike campaign anytime soon.

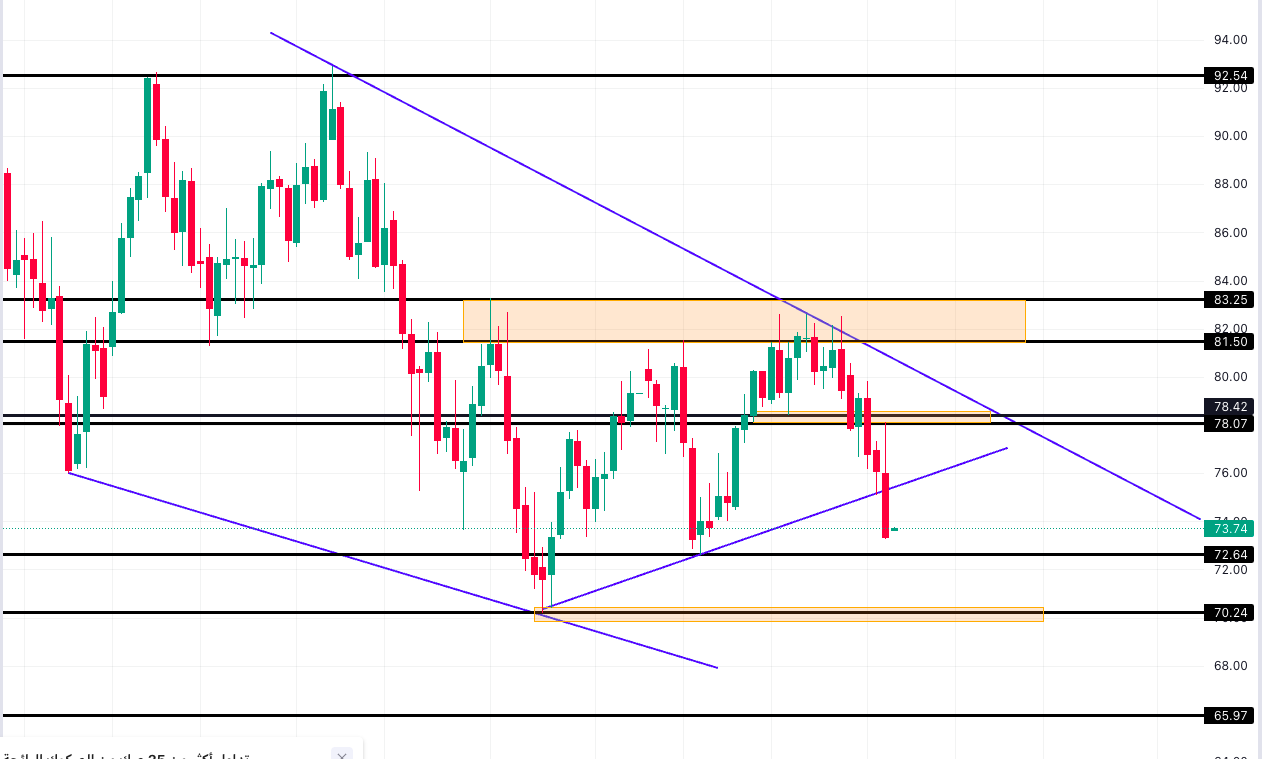
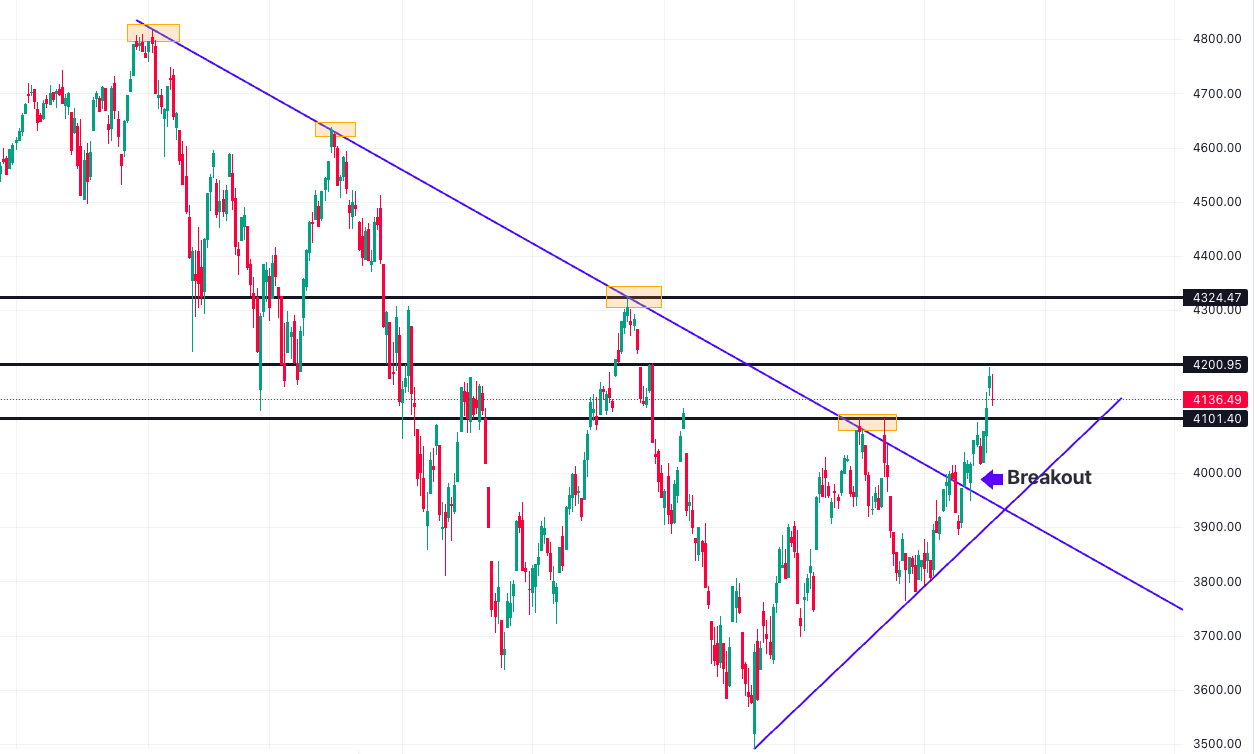
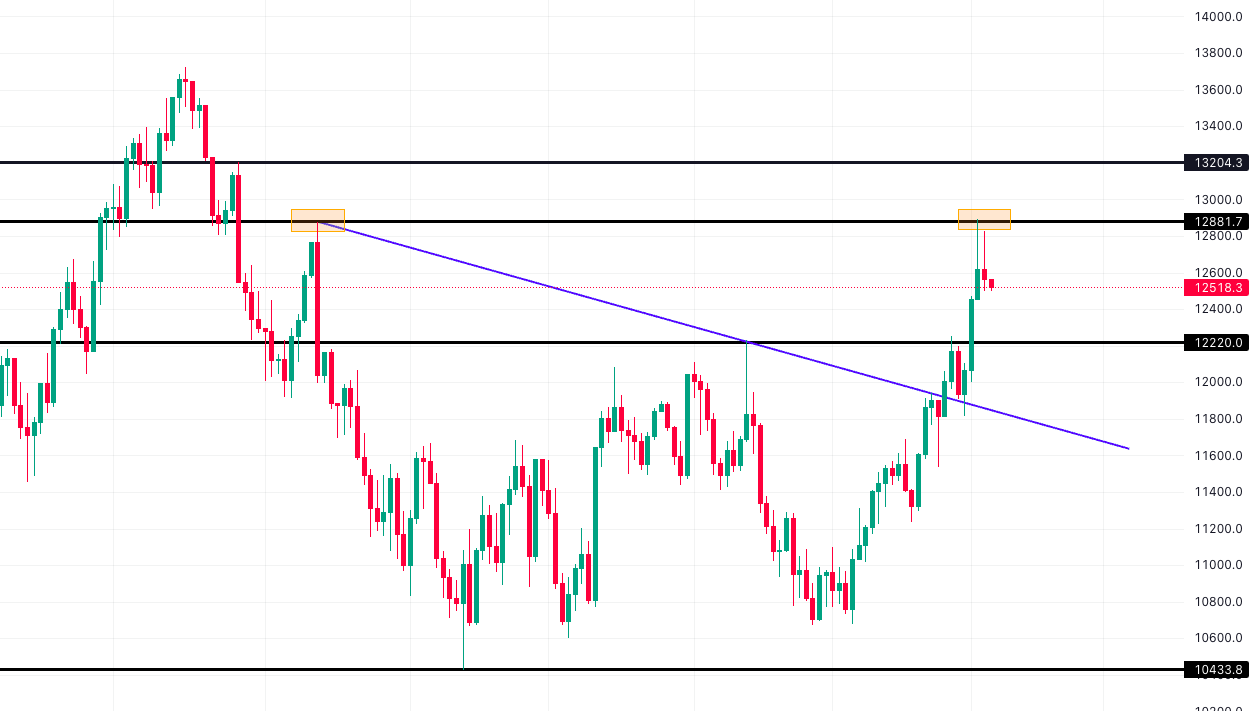
On the other side, Oil prices remain under pressure after the G7 agreed to expand sanctions on the Russian Oil industry. Meanwhile, the US stock market continues to hold steady since the beginning of the year backed by strong earnings, especially in the technology sector.

Now let us have a look at the monthly technical outlook for major currencies, commodities, and indices.

Feb 2023 Monthly Analysis

EURUSD

The Euro failed to overtake the psychological barrier of 1.1000 and showed clear signs of weakness at the beginning of the month.

Sellers managed to push prices below important support, which was located at the 1.0800 level, clearing the way for a new wave of decline in the direction of the yearly open area that stands around the 1.0700 level.

Technically, the trend has turned sideways, and it is possible that the Euro extend its decline to as low as 1.0710-1.0650 levels before we see price stabilization.

On the other side, the 1.0850-1.0885 zone should act as a strong resistance zone and any potential advance can face strong sellers from there.

This negative scenario is likely to remain valid if prices continue to trade below the 1.0930 high.   

GBPUSD

The British pound faced heavy selling after forming a clear double-top pattern at a key technical resistance located at the 1.2450 level.

In February, the pair is likely to trade sideways to lower as bearish momentum has clearly increased following the breakdown below the 1.2280-1.2260 support zone.

Looking at the recent price action, if the pair remains below the 1.2260 resistance, we might see another decline toward the 1.1900 support level. On the flip side, any bounce is likely to face strong resistance from the 1.2150-1.2170 resistance zone.

Moreover, a close below 1.1900 support can lead to a sharp decline that can reach the January low located at the 1.1845 level.   

USDJPY

The currency pair managed to bounce from the 127.20-128.00 support zone after being in a strong downtrend.

From a wider angle, despite that the pair remains in a bearish trend, we can see a continuation of the increase in the bullish momentum that can lead to a rise in the first half of the month toward the 132.90 resistance before seeing a pause in the current rally.

In extension, a weekly close above the resistance mentioned above might open the way for more gains in the direction of the monthly resistance located at the 134.75 level.

Meanwhile, if we see a failure from the resistance zone, a move down toward the 130.50-130.00 support zone will be highly anticipated.

Finally, it is important to note that the drop that started from the October peak remains intact, as prices continue to respect the lower highs and lower lows price structure, and only a weekly close above the 134.75 resistance might signal a trend reversal in the higher time frames.   

USDCAD

USDCAD continues to trade sideways inside a wide range located between the 1.3520 and 1.3230 levels.

Therefore, the market sentiment remains mixed, and a clear breakout is needed to confirm the next direction in this pair. From a technical standpoint, a close above the 1.3520 resistance should lead to an acceleration higher in the direction of the 1.3700 barrier.

On the opposite, a breakdown below 1.3230 support can trigger a strong decline in the direction of the 1.3100 level.

For the time being, the technical picture is neutral, therefore, traders should wait for more price action as a confirmation.    

GOLD

Gold has lost a big part of January’s gains, after the recent jump in the US Dollar and we have seen prices breaking below a key support zone that was located between 1900 and 1892 levels.

This month, the yellow metal can extend its decline towards $1842 per ounce followed by a strong support zone that stands between 1825 and 1815 levels, from where prices can start recovering.

Meanwhile, any potential advance may face strong sellers from the formerly broken support zone of 1890-1900 which is likely to turn into resistance.

To conclude, gold expectations remain positive over the long term, however, prices are expected to remain under pressure in February and only a weekly close above the highlighted resistance can confirm that the downside correction has ended.   

OIL (WTI)

Crude Oil is expected to fall in February as prices continue to trade below the 81.50-83.25 resistance zone as per the chart below.

The recovery seen at the beginning of the year has failed from a key technical resistance, and sellers succeeded to push prices below the 78.00 support level, reinforcing the bearish outlook.
For the time being, and looking at the recent price developments, Crude oil bears are expected to maintain control and send prices further lower toward the 72.60-70.25 zone in the coming weeks.

Finally, this scenario should remain valid only if prices continue to trade below the 78.00 peak. In extension, a close below the psychological support of 70.00 should trigger a big sell-off in Oil.   

Dow Jones (US30)

The Dow recovery has stalled at a key technical resistance located at the 34350 level.

The US index continue to look for a clear direction since the beginning of the year. The trend is sideways; therefore, we continue to expect choppiness during this month and traders should keep an eye on the resistance mentioned above, as a close above it can clear the way for a continuation higher in the direction of the 35,000 mark which lies near the December peak.

On the flip side, if prices remain below the 34,350 resistance, traders should expect a move lower in the direction of the 33,200 level followed by 32,900 support.

In sum, the trend remains neutral in the Dow Jones index and prices are likely to trade sideways in February until we see a clear exit outside of the current range.   

S&P500 (SPX)

The S&P 500 has begun to show signs of strength after breaking above an important falling trendline at the end of last month.

In February, we expect the index to start a correction lower toward the 4050-4000 support zone initially before seeing rising demand and another advance for a re-test of the 4200 area. Moreover, a close above the 4200 resistance should confirm the current positive momentum in the S&P and send prices higher in the direction of the August peak.

In the coming days, the index is likely to remain well-supported unless we see a weekly close below the 3885 support level, which can lead to a downside trend reversal.    

NASDAQ 100 (NAS)

The Nasdaq index is following an uptrend that started at the beginning of the year. Prices have formed a series of higher highs and higher lows after breaking above the falling trendline mentioned in the chart below, however, we might see a slowdown in the bullish momentum in the coming days as prices have reached an important resistance located at 12,880 level.

Therefore, a drop toward 12,200 former broken resistance remains possible this month before seeing another move to the upside. The bullish trend is likely to remain unchanged unless we see a weekly close below the 11,540 level.

In extension, a close above 12,880 resistance should lead to another rally toward the 13,200 level.    

امين-حياني
 

Economic Analyst
Amine Hiani

Scroll to Top