Daily market report

The US Dollar suffered heavy selling last week, after soft inflation data that came against expectations.
Despite the tone used by FED chairman Powell during the latest FOMC press conference, after raising interest rates by 75bps to reach highest since 2008, investors are actively looking for changes in monetary policy path to drive their investment decisions.
As we approach the end of the year, USD was vulnerable to profit taking after a very strong bull run.
From a technical standpoint, the US Dollar uptrend remains intact, and the recent drop is likely to be considered as a temporary pause in the existing trend.

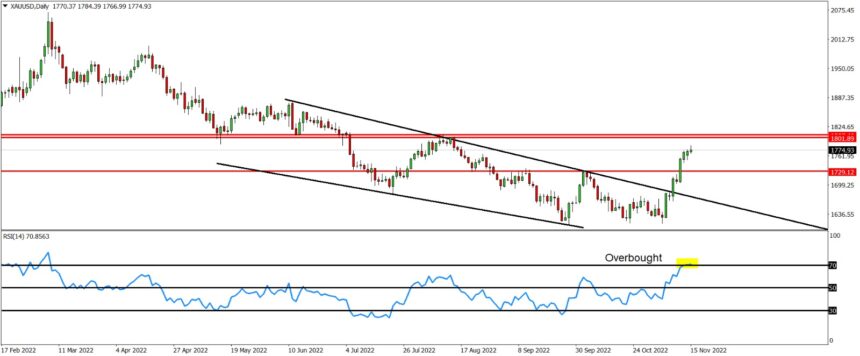
Looking now at the current price action for the major currency pairs alongside gold.

التحليل اليومي

EURUSD

After the recent rally we have witnessed in the single currency, prices managed to exceed a strong resistance level located at 1.1365 which represents the high seen in August. In addition, the pair has already retraced more than 61.8% from the recent decline that started from 1.0790 peak, therefore, while the current bullish momentum is still strong, it is expected to slow down in the coming days and the pair may start to trade sideways to lower. In the near-term, if prices manage to hold above1.0365 level, we might see a final push higher towards 1.0445-1.0990 zone before retracement to start. Looking at the hourly chart, a daily close below 1.0365 level can expose 1.0270 which is considered as a main support, while a break below this level can open the way for further decline in the direction of 1.0200 handle.

GBPUSD

The British pound was among the top gainers in the recent days and traded strongly against the US Dollar.
Looking at the technical picture, the currency pair managed to break above 1.1650 resistance which keeps the short-term trend to the upside, however, the potential for further gains may remain limited as the pair is expected to face strong sellers around 1.1850-1.1900 resistance zone.
In the short-term, traders should keep an eye on 1.1710 level as it represents the hourly support and a break below it can trigger a fast decline towards 1.1650 level.
For the time being, market participants should continue to monitor this pair and look for a break above 1.1830/50 zone, or below 1.1710 level to have more clues about the future price action.

USDJPY

USDJPY fell more than 9% from its yearly highly on the back of Bank of Japan recent market intervention coupled with disappointing economic data from the US. As volatility increased significantly in both Japanese Yen and the US Dollar, we will be looking at the daily chart to have an idea about the biggest picture. Technically, the current decline can be considered as a retracement of the bullish cycle that started from 130.45 low, and by now, the pair has reached a critical support zone which is the 61.8% Fibonacci golden ratio at the price of 138.65. Therefore, we might see a bounce that can push the pair back to 141.50/142.20 zone in the coming days. In the lower time frames, buyers can look for support at 139.10 level while sellers can find resistance at 140.80 level. To summarize, if the pair continue to hold above 138.45/65, the downside should remain limited, while a daily close below this zone should weaken this scenario and send prices further to the downside.

USDCAD

The currency pair continue to trade lower after showing a popular bearish reversal pattern (Head & Shoulders). Prices are likely to remain capped below 1,3360 high in the hourly chart and only a daily close above this level may signal a shift in the bearish pressure. Sellers are expected to challenge the 1.3230 low in the coming hours and a break below this level can trigger further losses towards the next support level which stands at 1.3175. Finally, the theoretical target of the H&S pattern is seen at 1.3025 level.

GOLD

The yellow metal rallied strongly after forming a triple bottom pattern around $1615 per ounce, the confirmation of the short-term reversal came with the break of 1729 which was the previous resistance level. As of now, the near-term trend is positive, however, when looking at the RSI indicator, Gold is trading at the overbought zone after testing 1782 hourly resistance, which can lead to a pause in the current momentum and a temporary drop in the coming hours. Despite, the current strength, traders should be patient and wait for a re-test of 1729 former broker resistance which is likely to become new support before to look for another leg higher again. In extension, 1800 handle is considered as the main resistance level in the coming days.
امين-حياني
 

Economic Analyst
Amine Hiani

Scroll to Top