Daily Market Report

The U.S Dollar faced heavy selling pressure following soft inflation data in the US.
The March CPI came out below expectations at 0.1%. Stocks and Treasuries rose after the release, amid optimism that the Fed is likely to stop raising interest rates. 

Moreover, the Bank of Canada kept the overnight interest rate unchanged at 4.5% and the central bank said that it expects “inflation to fall quickly to around 3% in the middle of this year and then decline more gradually to the 2% target by the end of 2024.”

Later today, US initial jobless claims are due to rise from 228K to 232K, while the UK GDP is expected to have declined in February from 0.3% to 0.1%.

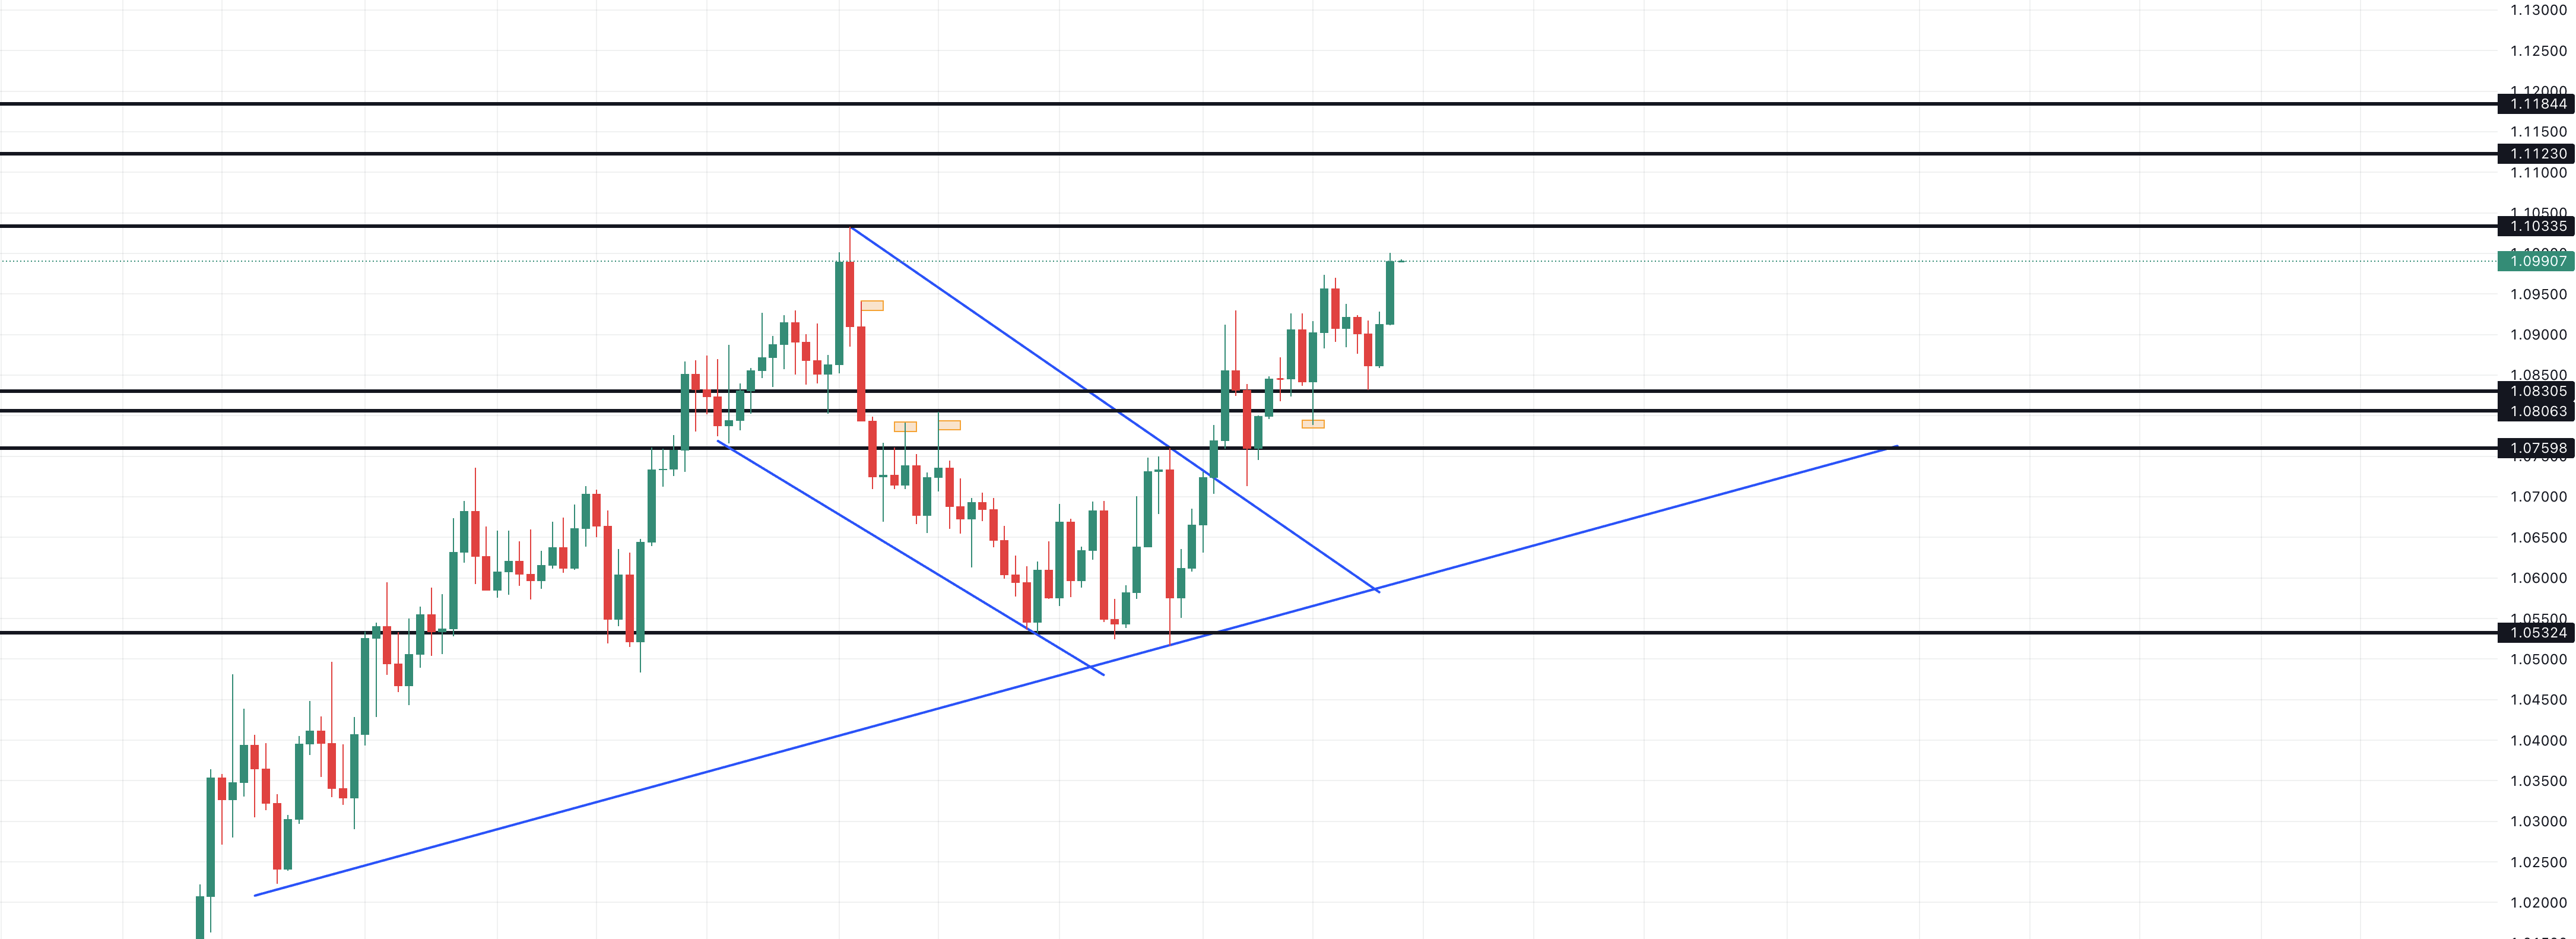
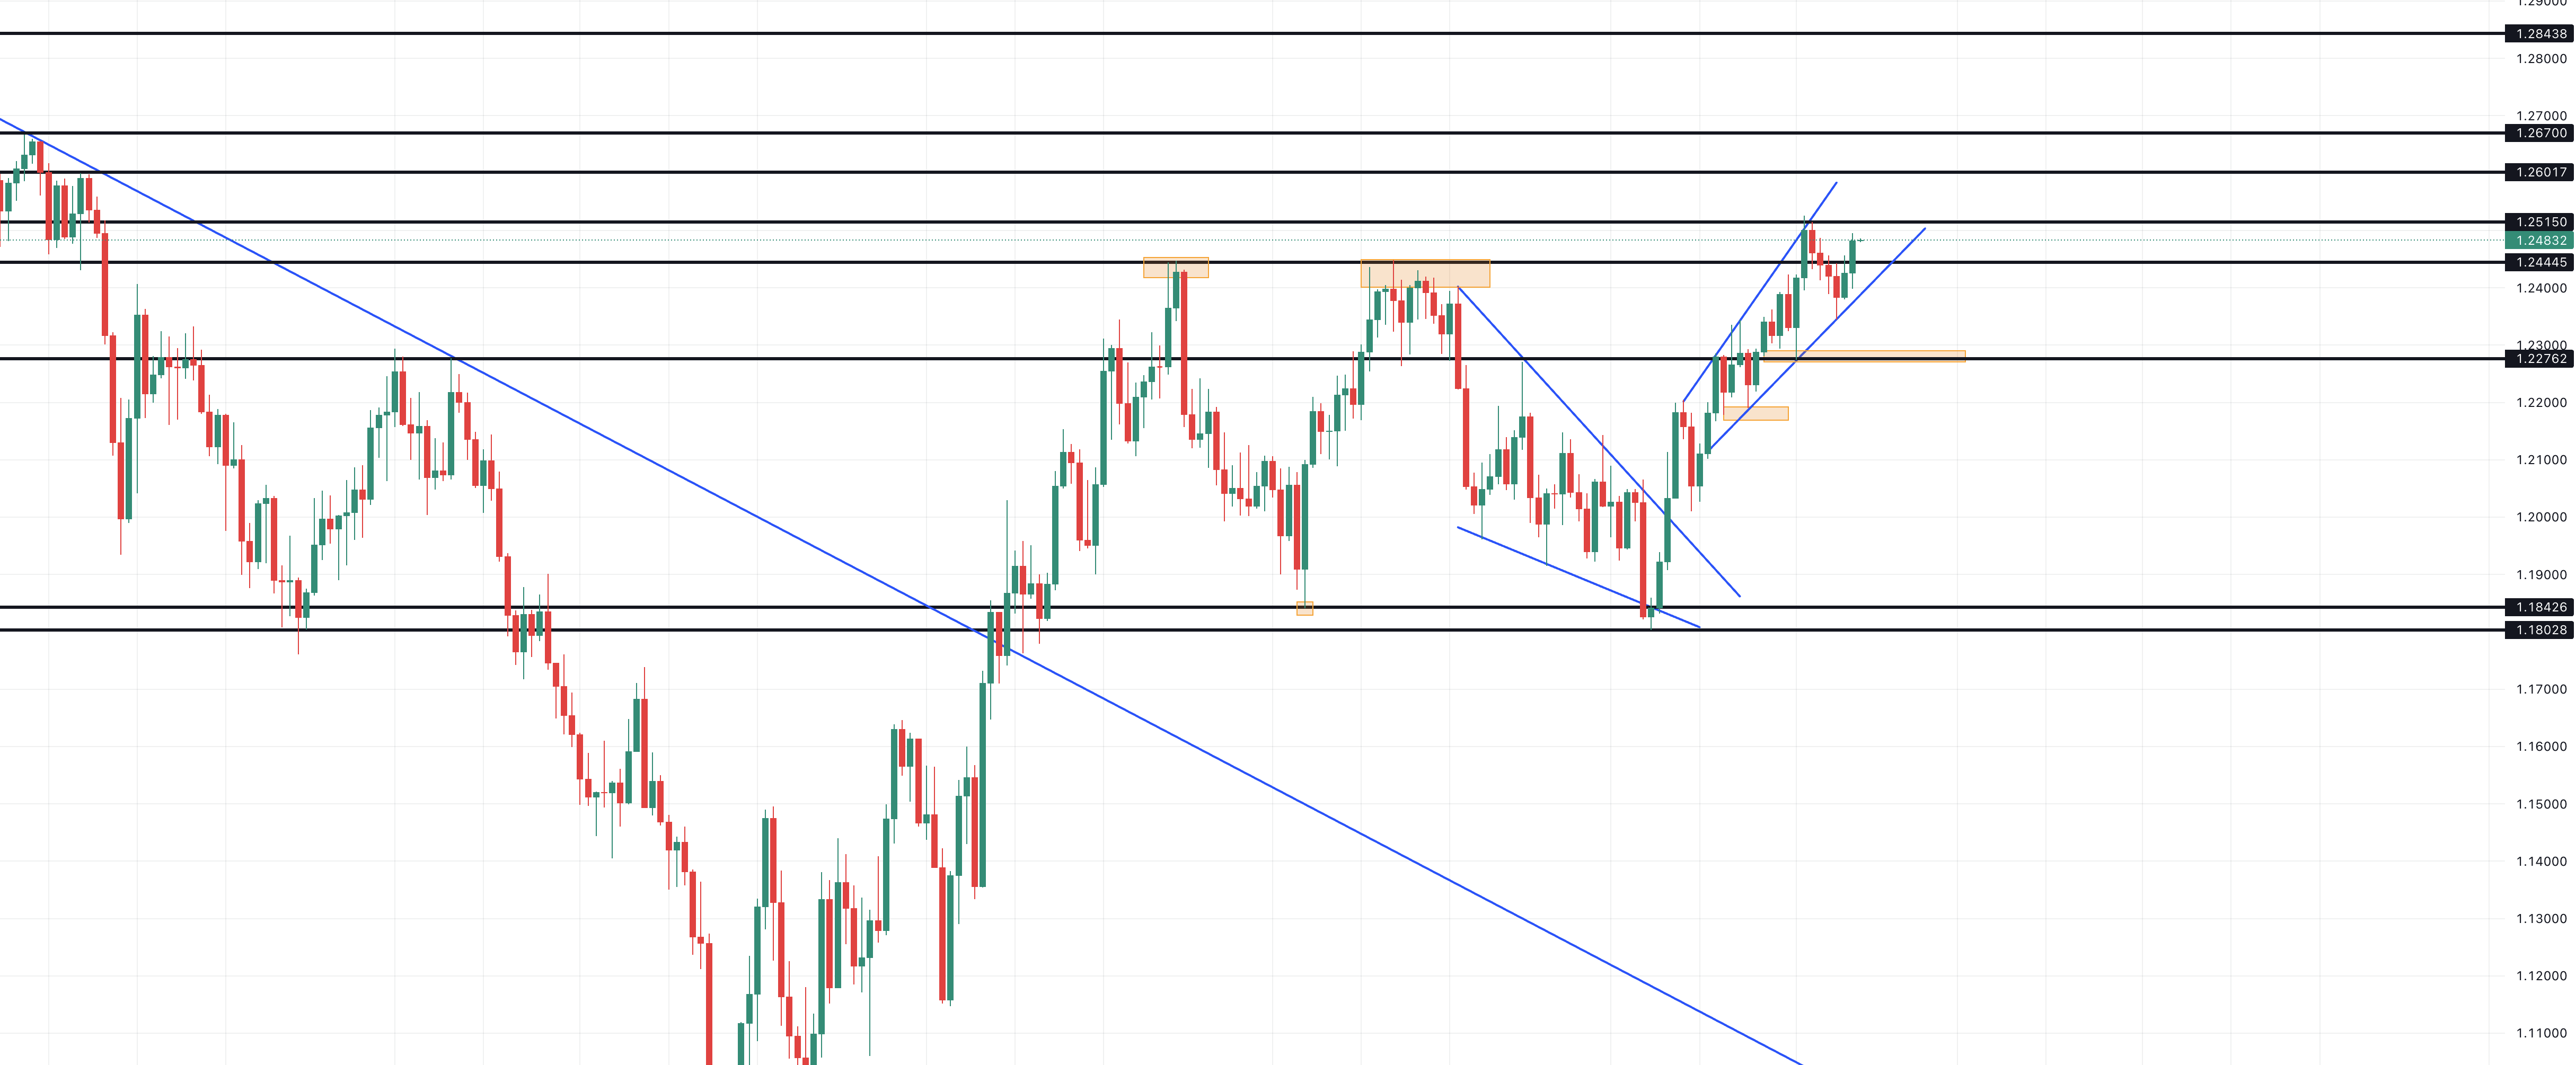
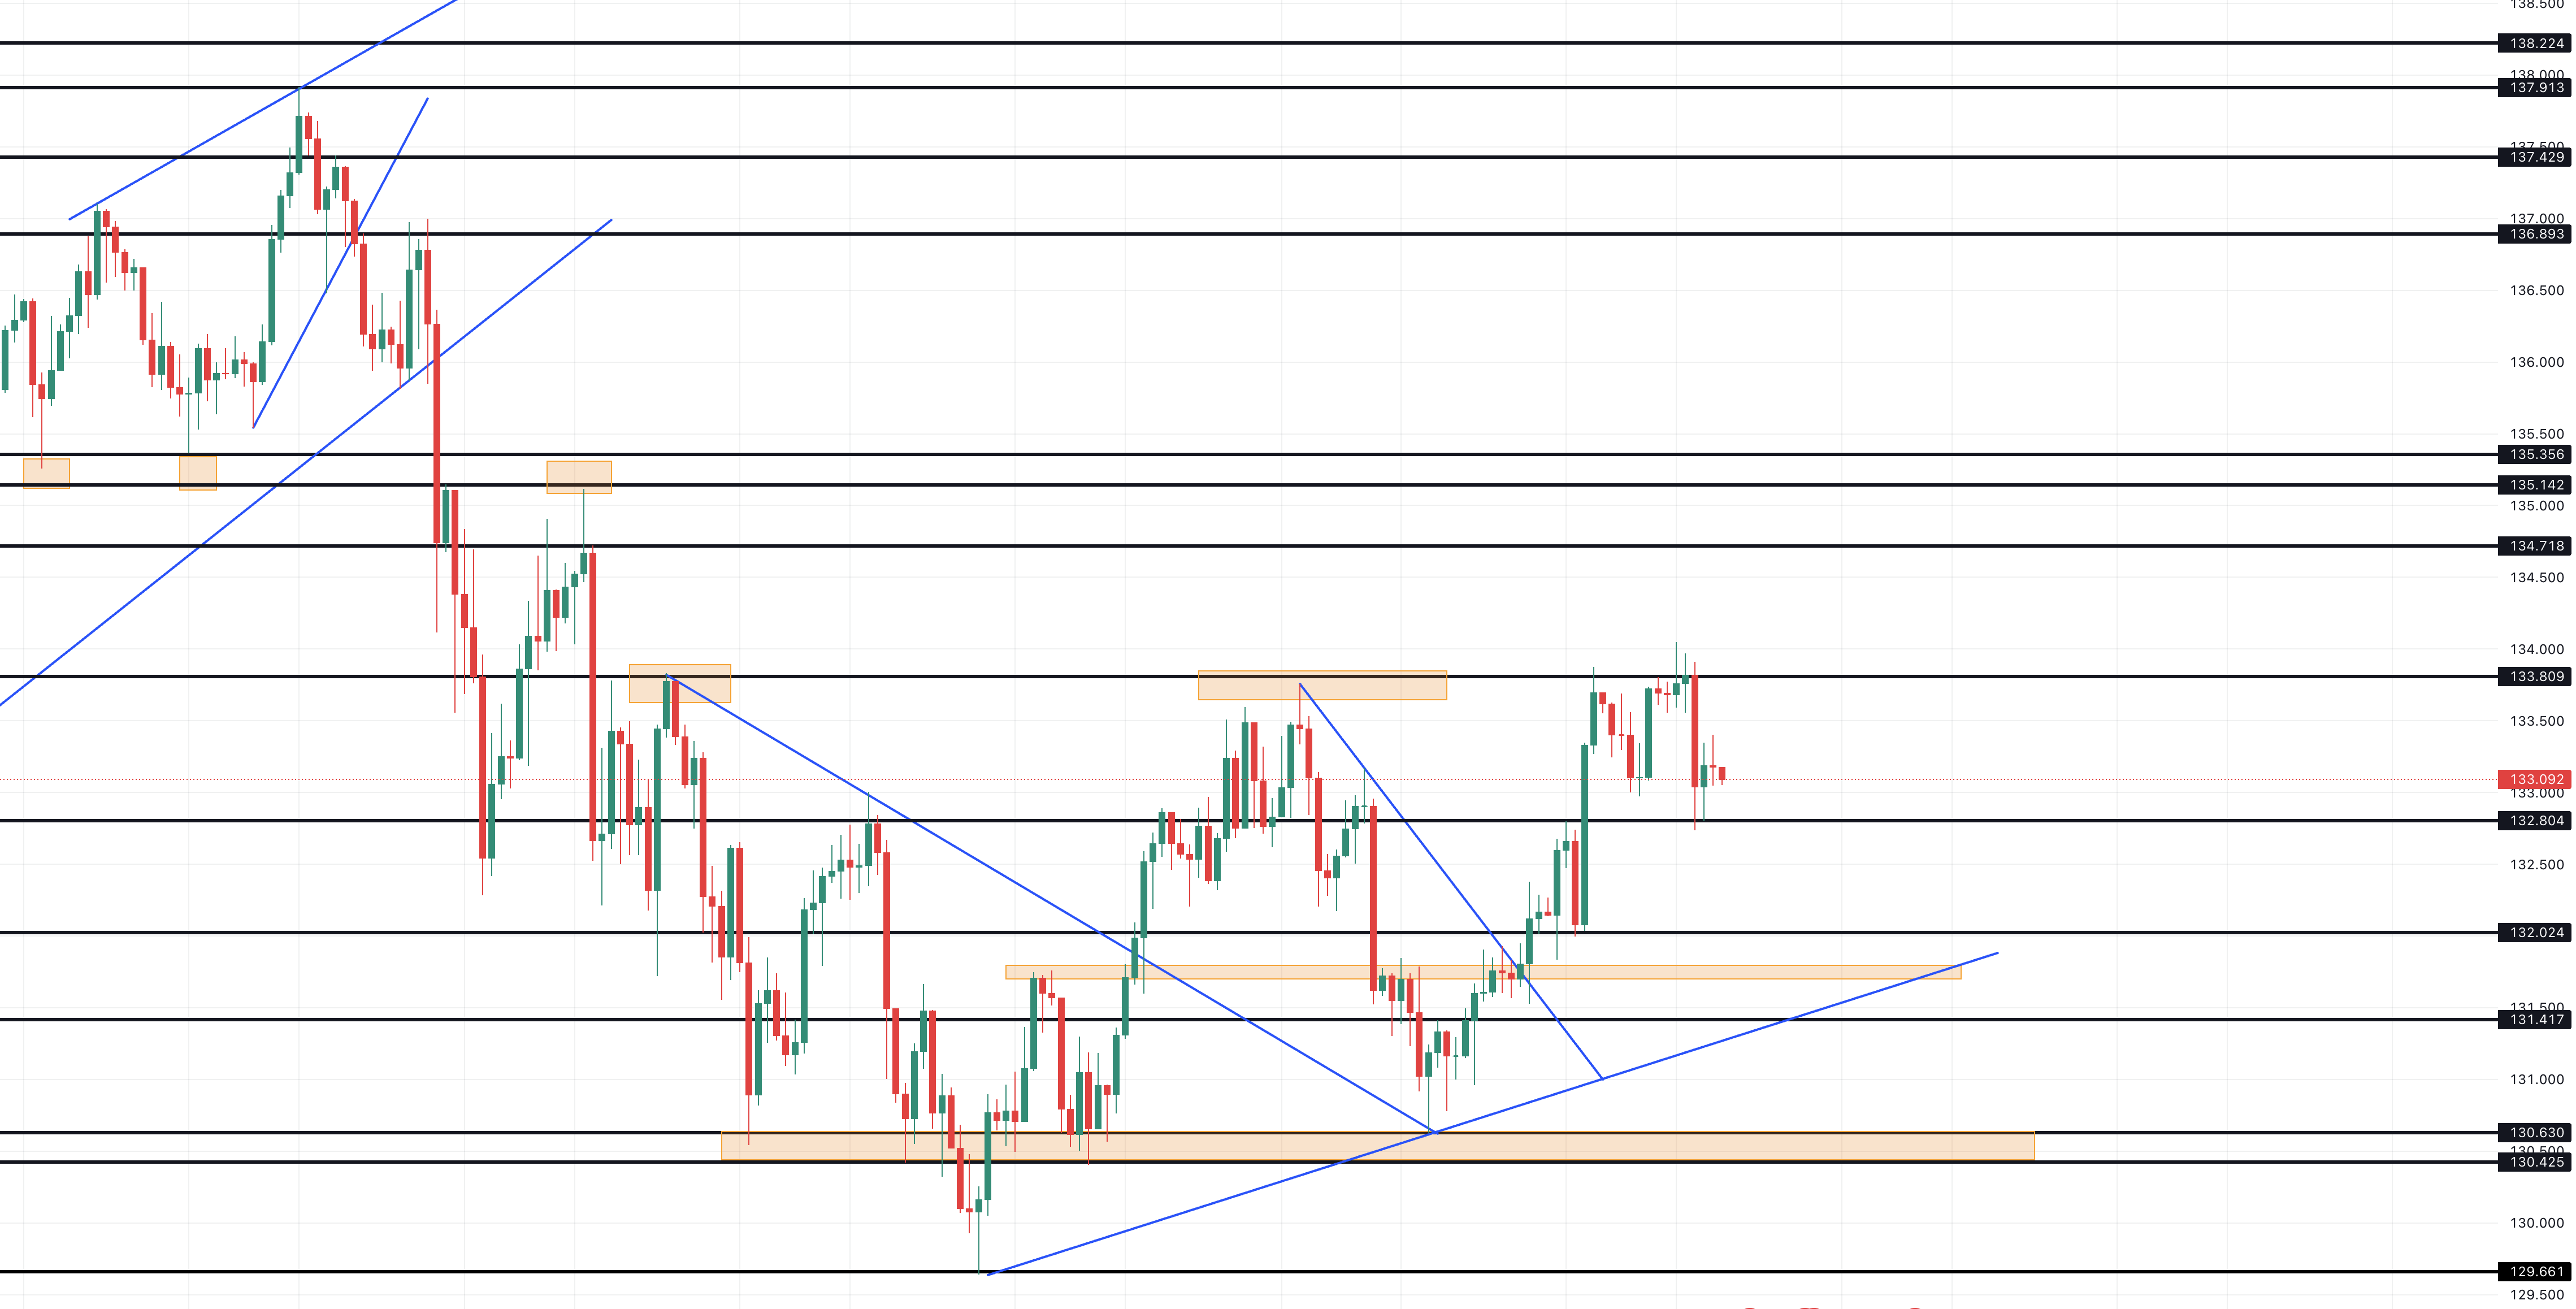
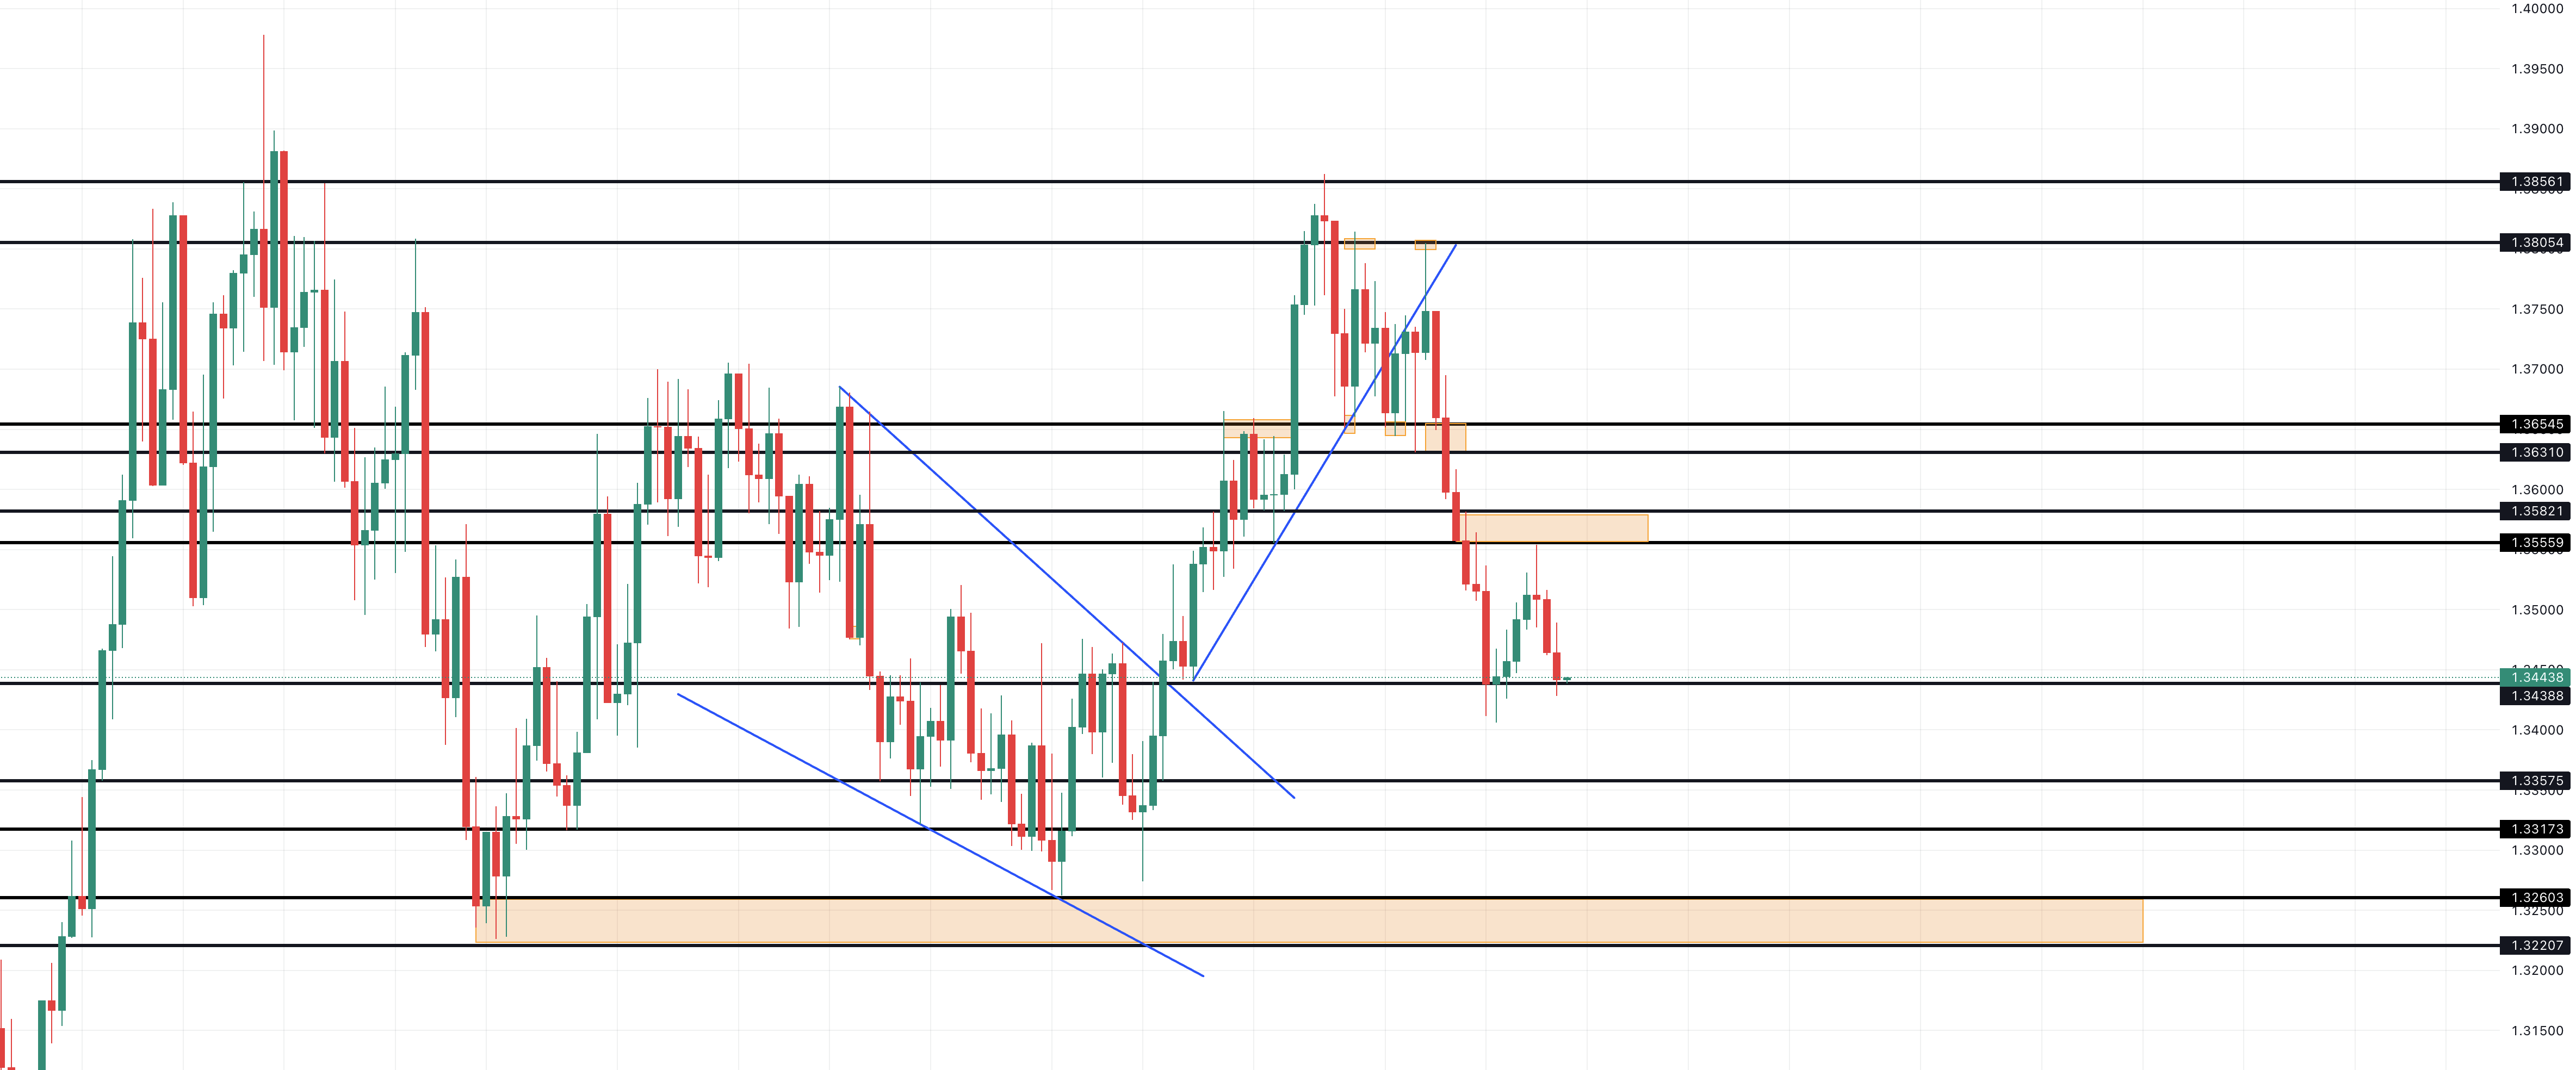
Below, we will be analyzing the latest price action developments in the major currency pairs alongside gold.

Daily market report (13-04-2023)

EURUSD

The pair rallied on Wednesday as the bullish momentum increased on the back of a weaker dollar hit by soft inflation figures in the US.

Technically, The Euro managed to break above the 1.0975 resistance and buyers are likely to test the psychological barrier of 1.1000. From a wider angle, a continuation to the upside can target February highs at 1.1033 followed by 1.1065 in extension, this positive scenario remains valid while prices continue to trade above the hourly support of 1.0895.

To conclude, the single currency has ended its short-term correction, therefore, we might see another advance in the coming hours.

GBPUSD

The British pound extended its advance after successfully breaking above the hourly resistance of 1.2445.

For the time being, this level is expected to act as new support if we do see a downside retracement in the coming hours. The trend is bullish in this pair, and buyers will aim for a retest of the daily resistance located at the 1.2520 level. In extension, a break above it should trigger a strong rally in the direction of 1.2600.

From a technical standpoint, the pair is trading inside a rising channel which reinforces the positive outlook, this pair is likely to remain well-supported while prices continue to hold above the 1.2400 support.

USDJPY

The pair failed to break above the key resistance of 133.80 as mentioned in our previous report. 

Prices showed a false breakout after trading briefly above the 134.00 level, before falling sharply and ending the day 100 pips lower. The recent price action suggests that sellers took the control of this pair in the near term, and we may see new selling pressure later today.
In the meantime, any bounce is likely to be temporary as the momentum has switched from bullish to bearish with the nearest support located at 132.80 followed by the 132.35 level in extension.

On the other side, a key resistance zone is located between the 133.40 and 133.55 levels, from where a continuation to the downside is expected.

USDCAD

The pair traded lower, in line with our expectations after a successful reversal from the key daily resistance level located at 1.3560.

The main trend is still bearish, and looking at the recent price action, we can see that prices have reached the hourly support of 1.3440 which can lead to a short-term bounce before the selling pressure resume toward the next support which stands at 1.3400 level followed by 1.3360 in extension.

In addition, traders should expect the pair to face more weakness while prices continue to hold below the 1.3490 level.

GOLD

We have seen increased volatility for Gold during yesterday’s US trading session, as the yellow metal rallied following the US CPI release reaching a high of $2028 per ounce before reversing lower toward the 2000 psychological support.

Meanwhile, we saw another bounce in gold before yesterday’s close which keeps the positive outlook unchanged. The trend remains bullish and therefore, the recent decline should be considered corrective only. Consequently, if gold continues to hold above the 1995 low registered earlier this week, there will be a high probability for a retest of the 2028-2032 resistance zone in the coming days.

The next level of interest for buyers stands at the 2006 level which represents short-term support. On the flip side, the 2019-2022 levels are expected to act as an initial resistance zone.

امين-حياني
 

Economic Analyst
Amine Hiani

Scroll to Top